

Ultimate Guide To Engagement Metrics Tracking
Ultimate Guide To Engagement Metrics Tracking
![]() 28-06-2025 (Last modified: 04-07-2025)
28-06-2025 (Last modified: 04-07-2025)
Engagement metrics tell you how users interact with your website, app, or content. They go beyond basic traffic stats to measure the quality of interactions, like clicks, shares, time spent on a page, and conversions. High engagement means your content resonates with users, while low engagement signals areas for improvement.
Key takeaways:
- Why it matters: Engagement metrics influence search rankings, user experience, and business outcomes. Poor metrics, like slow page load times, can drive users away.
- Metrics to track: Conversion rate, session duration, pages per session, social media engagement, customer retention, churn rate, and Net Promoter Score (NPS).
- Tools to use: Platforms like PageTest.AI simplify tracking with real-time insights, A/B testing, and data visualization.
- Strategies: Segment audiences, analyze trends, set benchmarks, and ensure data accuracy to improve user engagement and conversions.
Engagement Metrics SIMPLY Explained in Google Analytics 4 (GA4)
Key Engagement Metrics and Their Definitions
Tracking engagement metrics helps measure how well your website and content connect with users. These metrics, when analyzed together, provide a clear picture of how effectively your audience is engaging with your digital presence. Let’s break down the key metrics and what they reveal about your audience.
Conversion Rate
The conversion rate represents the percentage of users who take a specific action on your website or app – like making a purchase, signing up for a newsletter, or downloading a resource. It’s calculated using the formula:
Conversion Rate = (Number of Conversions / Total Number of Visitors) × 100
For instance, if 1,000 people visit your landing page and 50 of them complete the desired action, your conversion rate would be 5%. A higher conversion rate often reflects strong customer engagement, effective marketing, and a positive user experience, showing how well you’re turning visitors into customers.
Pages Per Session and Average Session Duration
Pages Per Session measures how many pages a user typically views during a single visit. It’s calculated by dividing the total number of pageviews by the total number of sessions. A good benchmark is around 2 to 3 pages per session, while anything under 1.5 pages may suggest weak engagement.
Average Session Duration tracks how much time users spend on your website per visit. This is determined by dividing the total session time by the number of sessions. For most websites, an average session duration of 2 to 3 minutes or more is considered a solid performance.
“Average session duration is one of those signals based on merit, meaning it’s hard to game it. You can’t improve it by advertising, by stuffing more keywords onto your page, or by writing more clickbaity headlines.”
- Dann Albright, B2B Marketing Writer
To boost session duration, focus on creating engaging content, improving site usability, adding interactive elements, and ensuring your website runs smoothly.
Post Engagement Rate and Social Interactions
Post engagement rate measures how actively your audience interacts with your social media content. This includes likes, shares, comments, saves, and clicks, relative to your total reach or impressions. The formula is:
Engagement Rate = (Total Engagements / Total Reach) × 100
In 2024, the average number of daily engagements per post across industries was 14. However, this number can vary depending on your platform, industry, and audience size. Interestingly, 65% of marketing leaders believe it’s crucial to show how social media efforts connect to business goals to secure stakeholder support.
Customer Retention and Churn Rates
Customer Retention Rate tracks the percentage of customers who continue using your product or service over time, while Churn Rate measures the percentage of customers who stop using it. A high churn rate can signal dissatisfaction, whereas a low churn rate often reflects strong engagement. By monitoring these two metrics together, you can better understand the health of your customer relationships. Engaged customers are more likely to stay loyal, spend more, and recommend your business to others.
Net Promoter Score (NPS) and Customer Satisfaction
Net Promoter Score (NPS) is a simple yet powerful way to measure customer loyalty. It’s based on one question: “How likely are you to recommend our product/service to a friend or colleague?” Customers respond on a scale from 0 to 10, and their answers are categorized as follows:
- Promoters (9–10): Loyal customers who are likely to recommend your brand.
- Passives (7–8): Satisfied but not enthusiastic customers.
- Detractors (0–6): Unhappy customers who could damage your brand’s reputation.
To calculate NPS, subtract the percentage of Detractors from the percentage of Promoters. This metric complements other engagement indicators by providing insight into how customers feel about their overall experience with your brand.
Tools and Platforms for Engagement Metrics Tracking
Selecting the right tools to monitor engagement metrics can be the difference between drowning in data and uncovering actionable insights. The most effective platforms combine powerful analytics with easy-to-use interfaces, offering clear and intuitive data visualization. Since the human brain processes visual information more efficiently, tools that prioritize visual clarity alongside detailed measurement capabilities are essential. Let’s take a closer look at how a dedicated platform can simplify and enhance your engagement tracking.
Overview of PageTest.AI
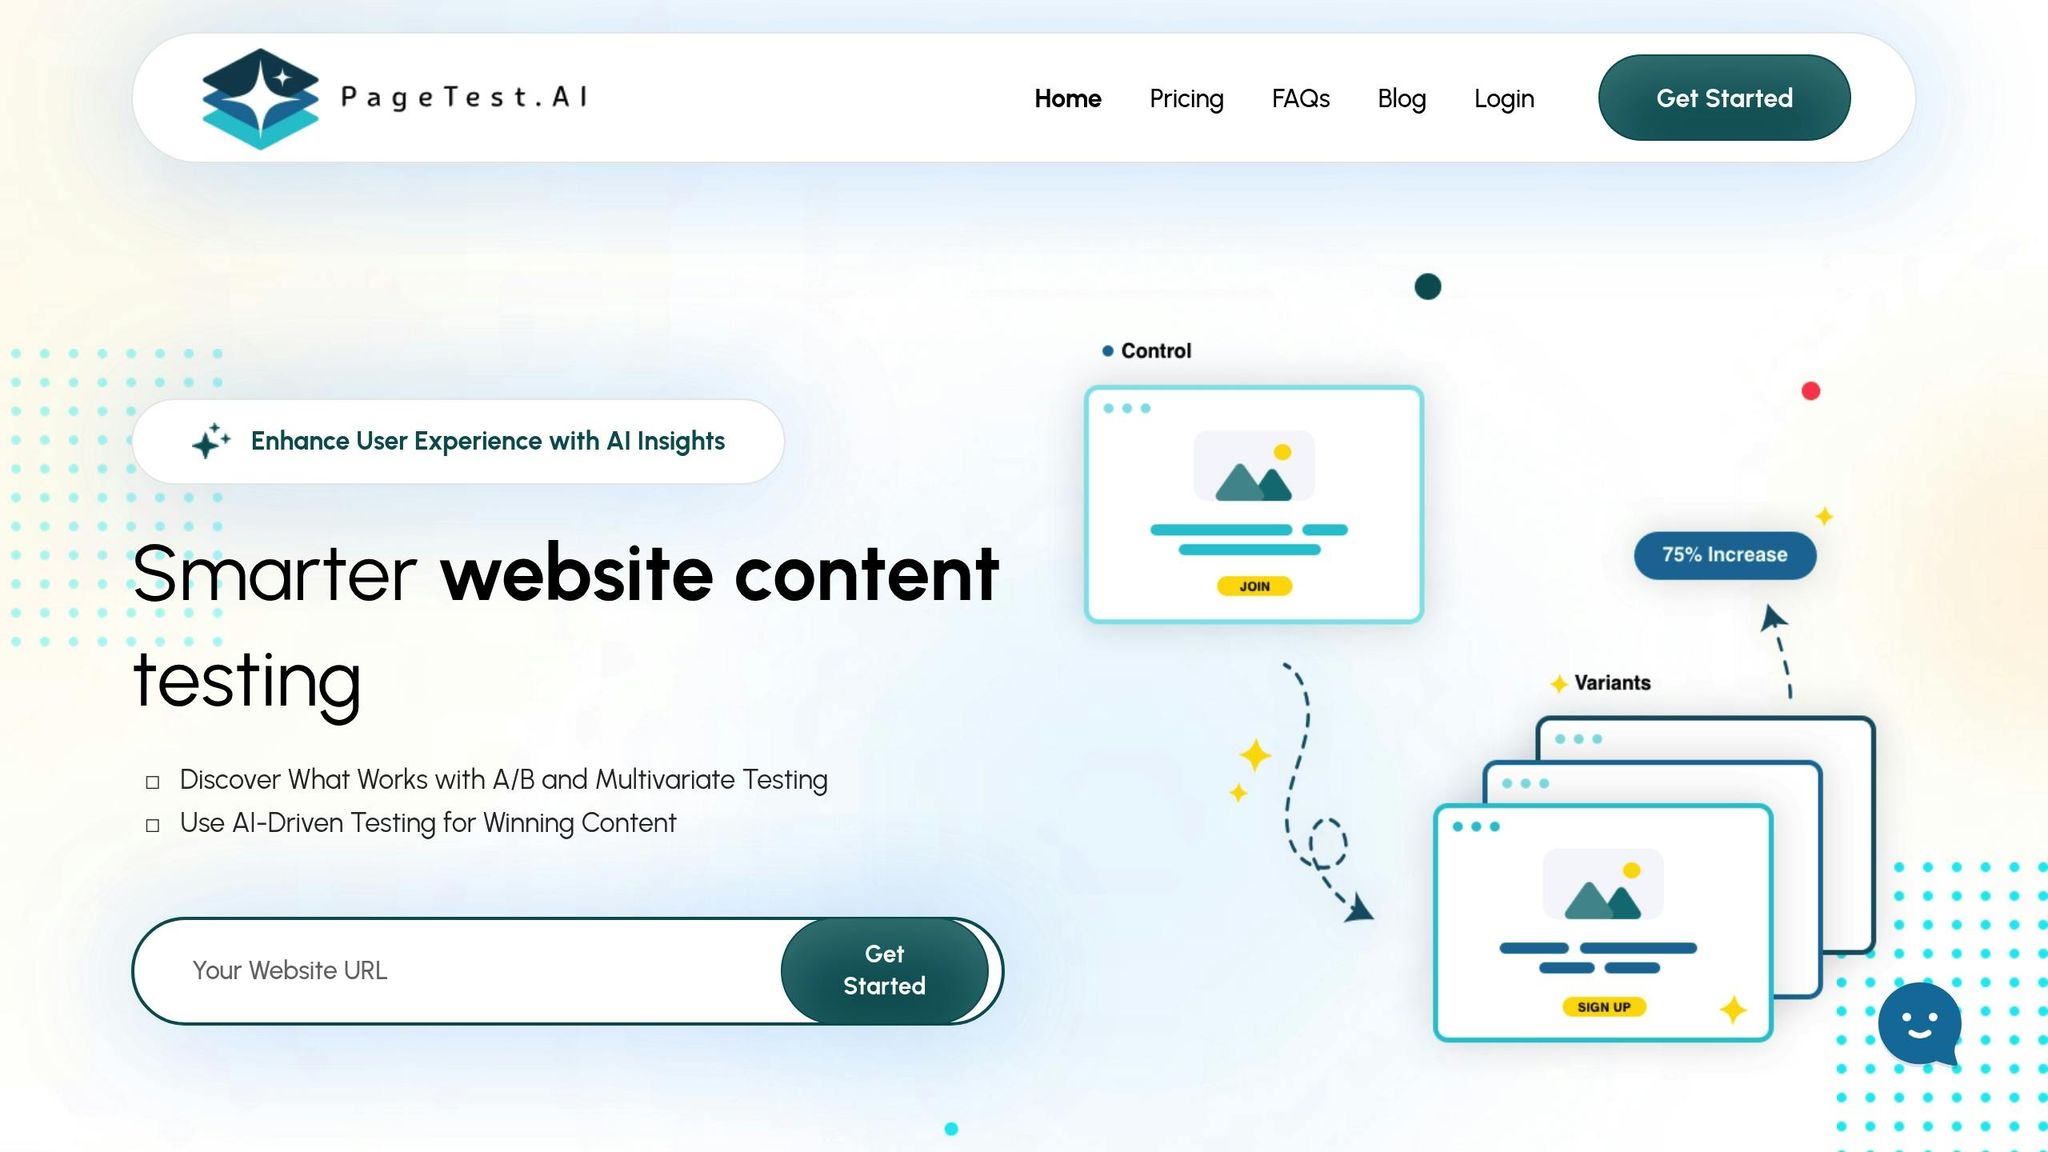
PageTest.AI is an AI-driven platform designed to optimize conversion rates while simplifying the process of tracking engagement metrics. Its no-code interface makes it accessible to users without technical expertise, focusing on real user behavior by monitoring key indicators like clicks, time spent on a page, scroll depth, and interaction patterns.
One standout feature of PageTest.AI is its ability to test multiple content variations simultaneously. Using its Chrome extension, you can select specific website elements – such as headlines, CTAs, or product descriptions – and generate AI-powered variations to test against your original content. This allows you to see, in real time, how users interact with different versions of your content. For example, you can determine which headline keeps visitors engaged longer, which button text drives more clicks, or which product description encourages deeper scrolling.
The platform integrates effortlessly with popular website builders like WordPress, Wix, and Shopify, making it a versatile choice regardless of your technical setup. Thanks to its no-code approach, you can start tracking engagement metrics within minutes – no developers or complicated integrations needed.
PageTest.AI also offers flexible pricing plans to accommodate businesses of all sizes:
| Plan | Monthly Price | Test Impressions | Pages | Tests | Websites |
|---|---|---|---|---|---|
| Trial | $0 | 10,000 | 5 | 5 | 1 |
| Startup | $10 | 10,000 | 10 | 10 | 1 |
| Enterprise | $50 | 100,000 | 100 | 100 | 10 |
| Agency | $200 | 1,000,000 | Unlimited | Unlimited | 100 |
Data Visualization and Reporting Features
PageTest.AI doesn’t just make tracking easier – it also excels in presenting data through robust visualization tools. Effective engagement tracking depends on how well you can interpret your data and turn it into actionable insights. Visualization tools transform raw metrics into user-friendly formats like charts, graphs, and dashboards, helping you spot trends and patterns that might otherwise go unnoticed.
For instance, companies like Walmart and Netflix rely heavily on data visualization. Walmart uses analytics to monitor seasonal demand patterns across its global stores, enabling precise inventory adjustments. Netflix employs interactive dashboards to analyze viewership trends and content preferences, guiding programming decisions and enhancing user engagement.
Visualizing data not only speeds up decision-making but also improves communication across teams. Instead of sifting through endless spreadsheets, stakeholders can quickly grasp trends through interactive visuals. Dashboards allow users to dive deeper into specific metrics, compare performance over time, and uncover correlations between data points.
To make the most of your engagement visualizations, focus on these key principles:
- Select the right chart type to clearly convey your message.
- Highlight essential data points to avoid overwhelming your audience.
- Use color strategically to draw attention to critical insights.
For example, Walmart uses color-coded heatmaps on dashboards to indicate inventory levels across different regions, making it easier for teams to prioritize restocking efforts.
sbb-itb-6e49fcd
Advanced Strategies and Best Practices
Taking your strategies to the next level means diving deeper into data to uncover patterns that can genuinely transform your business. By moving beyond basic tracking, you can gain insights that drive smarter decisions and better outcomes.
Segmentation and Trend Analysis
If you want to get more out of your data, segmentation and trend analysis are the way to go. Segmenting your audience means dividing users into specific groups based on factors like demographics, behavior, location, or even their interests. This lets you tailor your marketing efforts to resonate with each group, making your campaigns more effective. For example, Spotify uses segmentation brilliantly with its personalized playlists. By analyzing users’ listening habits, Spotify creates custom 30-song mixtapes that align with individual tastes, leading to much higher engagement compared to generic playlists.
Trend analysis, especially cohort analysis, digs deeper into how user behavior evolves over time. Instead of looking at one-off data points, this approach groups users by shared characteristics or the time they joined, helping you track changes over months or years. For instance, you can compare how users who signed up in January behave versus those who joined in June. Netflix is a standout example here. They combine data like watch time, completion rates, and search history to refine their recommendations and improve their platform. This not only enhances user engagement but also shapes their marketing strategies.
Another great example is Under Armour. They gather behavioral data from their massive fitness community of over 200 million users without directly asking for input. By spotting trends – like a rise in weightlifting or cycling activities – they adjust their product lines. For instance, if cycling gains popularity, they might focus on developing specialized gloves for that audience.
Setting Performance Benchmarks
Benchmarks are your roadmap for measuring progress. They help you figure out if your engagement metrics signal success or if there’s room for improvement. To set realistic benchmarks, you need to blend past performance, industry standards, and future goals.
The key is to focus on metrics that align with your goals. For example, a sales team might zero in on customer acquisition cost (CAC) and lead conversion rates, while a customer success team might prioritize customer satisfaction (CSAT) and Net Promoter Score (NPS). Say you’re in the SaaS industry, where retention rates typically hover around 85%. If your current rate is 80%, a goal of 87% within the next year is ambitious but achievable. Similarly, in manufacturing, where production efficiency averages 90%, improving from 88% to 92% by the end of the year could be a solid target.
To make your benchmarks more actionable, break them down. Analyze performance by product category, customer segment, location, channel, or even device type. This can help you spot gaps in performance that might be hidden in overall numbers. Focus on the areas where your metrics lag behind industry standards, dig into the reasons, and test potential solutions.
Ensuring Data Accuracy and Privacy
Benchmarks are only as good as the data behind them. Poor data quality is a costly issue, with businesses losing an average of $12.9 million annually due to inaccuracies. Shockingly, 95% of companies suspect their customer and prospect data isn’t reliable.
Common culprits include human errors, outdated records, and duplicate entries. Automation can help tackle these issues by streamlining data collection and reducing errors. Strong data governance practices – like standardizing data entry and conducting regular audits – are also essential. Centralizing your data ensures everyone is working with the same, accurate information, and collaboration between IT and analytics teams can align data practices across your organization.
Privacy is another critical factor. Beyond avoiding penalties, robust privacy programs can actually boost your bottom line. Companies that invest in these programs see returns that are often double their spending, with benefits ranging from $2.7 to $3.4 million. These programs not only enhance data management but also build trust with customers.
“Continuous monitoring and improvement are essential for sustaining data quality. It allows organizations to proactively identify and address data quality issues before they impact business operations.” – Robert Wilson, Data Quality Analyst, 456 Enterprises
Maintaining data quality isn’t a one-and-done task – it’s an ongoing effort. Establish a governance framework that clearly defines roles and responsibilities for managing data. Engage stakeholders to set quality standards and expectations, and educate employees on best practices. By keeping your data accurate and secure, you’ll be in a better position to make segmentation and trend analysis work for you.
Using Engagement Metrics to Drive Optimization
We’ve already covered the key engagement metrics – now it’s time to put them to work. By leveraging these insights, you can refine your digital strategies and improve user experiences through systematic testing.
Iterative Testing and Refinement
To boost performance, make iterative changes based on engagement data. A/B testing is a powerful method for this. Tools like PageTest.AI’s no-code Chrome extension allow you to test specific elements, such as headlines or CTAs, to see what resonates most with your audience. When done right, A/B testing can increase conversions by as much as 300%.
With PageTest.AI, you can create AI-generated content variations and track key metrics like clicks, time on page, and scroll depth. These insights give you a clear understanding of how users interact with different versions of your content.
Set measurable goals for your tests. For instance, if high bounce rates suggest your headlines aren’t engaging enough, try testing alternative headlines to increase session duration.
“A/B testing takes the guesswork out of landing pages. There are so many aspects to test, it’s imperative to understand what changes will ultimately drive more form fills. Changing the CTA button color could give you a 25% increase, while increasing the length of your body copy could decrease conversions by 33%. The only way to understand how to optimize the landing page experience with precision is through A/B testing.” – Gregory Batchelor, VP of Marketing at AB Tasty
For reliable results, run experiments for at least two weeks to account for factors like weekday trends and seasonal shifts. This ensures your findings reflect real user behavior, not temporary spikes or dips.
This method has delivered impressive results for many companies. Highrise saw a 102.5% increase in paid signups, TruckersReport boosted conversions by 79%, and Blue Fountain Media achieved a 42% rise in conversions through consistent A/B testing.
Document your tests, including hypotheses and outcomes, to build a valuable resource for future optimization efforts. This also helps you avoid repeating strategies that didn’t work.
Next, let’s explore how combining engagement metrics with conversion data creates a more comprehensive optimization strategy.
Combining Engagement Data with Conversion Insights
Taking your testing further, merge engagement metrics with conversion data to gain a deeper understanding of user behavior. This combined view reveals not only what users are doing but also why they’re acting that way – and where your biggest opportunities lie.
Start by examining how engagement patterns align with conversion rates. For example, if pages with longer session durations also have higher conversions, focus on creating content that keeps users engaged.
“I will always look at sessions, traffic sources, and conversion rates before anything else. When working to improve any of these metrics, many more engagement metrics become relevant and interesting, as they reveal where and how I can improve the customer experience.” – Phil Vallender, Director at Blend Marketing and HubSpot Elite partner
Personalization becomes far more effective when guided by both engagement and conversion data. For instance, personalized CTAs perform 202% better than generic ones, but only when they’re informed by real user behavior. Use your data to identify how different audience segments interact with your content, then craft personalized experiences that guide them toward converting.
Cambridge Education Group (Digital) serves as a great example. Suzanne Bull, Director of Content and Communications, shared their approach:
“We’ve looked at improving pages with a high number of new visitors. By providing better links to more Top-of-the-Funnel content on these pages, we’ve seen an improvement in conversion rates. Visitors can take a clearer journey through content they’ll value, building trust and keeping them engaged to the point that they inquire.”
Technical performance also plays a critical role. Pages taking longer than one second to load see bounce rates increase by over 100%, and 42% of users will abandon a site due to poor functionality. Combining this data with conversion insights helps you prioritize which pages need immediate attention based on traffic and conversion potential.
Mobile optimization is equally vital, with mobile devices accounting for 61% of global traffic and 63% of users preferring to access brand information on their phones. Analyze how engagement differs between desktop and mobile users, then tailor your strategies accordingly.
Trust signals can be strategically placed to maximize impact. For example, Vegetology increased conversions by adding testimonials above the fold, while visitors who interact with reviews are 58% more likely to convert. Use engagement data to pinpoint high-traffic areas and position trust elements where they’ll have the greatest effect.
Real-world examples highlight the success of this approach. A UAE fashion brand used behavioral data to send personalized push notifications, achieving 4× more conversions and a 300% revenue increase in one year. Similarly, MyPostcard boosted signups by 318% and increased user value by 16% in just one month by combining A/B testing with analytics.
Treat engagement and conversion data as complementary tools. If users spend significant time on your site but don’t convert, that’s a signal to evaluate content quality versus conversion optimization. Conversely, high conversions with low engagement might indicate you’re targeting the right audience but missing opportunities to deepen their connection.
Tools like heatmaps and session recordings can help you dig deeper. For instance, if users are spending time on a specific section but not taking action, heatmaps can reveal where they’re clicking – or where they’re stuck.
This approach leads to sustainable improvements. By understanding how users interact with your content and what drives them to convert, you can create experiences that meet immediate goals while laying the groundwork for long-term customer relationships.
Conclusion and Key Takeaways
Tracking engagement metrics sheds light on how customers interact with your brand, echoing Peter Drucker’s famous words: “If you can’t measure it, you can’t improve it”.
The numbers tell a compelling story: Companies that focus on customer engagement experience a 63% boost in customer loyalty, while those that effectively use analytics report a 15% rise in profitability compared to their counterparts who don’t. These aren’t abstract statistics – they highlight tangible advantages in today’s data-driven world.
Focus on key metrics like conversion rates, session duration, social media interactions, retention, and Net Promoter Score (NPS) to better understand user behavior. For example, Target’s personalized marketing campaigns and the Cleveland Clinic’s operational improvements showcase how leveraging these insights can enhance sales and service efficiency.
Utilize tools like PageTest.AI for actionable, real-time engagement data. This platform tracks clicks, engagement levels, time spent on pages, and scroll depth – offering valuable insights without the need for developer input.
Data-driven decision-making is a game changer. Companies that embrace this approach make decisions five times faster. Define clear goals for your engagement metrics, whether it’s boosting customer satisfaction or improving retention. For instance, a major retailer that tied engagement metrics to their strategy saw a 15% increase in customer retention within a year by implementing feedback systems and directly linking engagement indicators to revenue.
Regularly reviewing your metrics can lead to a 20% productivity boost. By integrating these insights into your strategy, you create a blueprint for ongoing improvement and maintain a competitive edge.
Start small. Make targeted changes based on these metrics, and watch them build into a strategic advantage. Let data guide your decisions, turning uncertainty into clear, actionable strategies.
FAQs
How can engagement metrics help improve my website’s user experience and boost conversions?
Engagement metrics like bounce rate, time on page, and click-through rate offer a window into how users interact with your website. These numbers can help pinpoint trouble spots – such as pages with a high bounce rate or low engagement – that might signal confusion, disinterest, or friction in the user experience.
To address these issues and enhance user satisfaction, consider practical steps like speeding up page load times, streamlining navigation, or tailoring content to your audience. Boosting engagement not only keeps visitors coming back but also builds trust and drives more conversions. By consistently monitoring these metrics, you can make informed adjustments to your site, leading to tangible improvements and better results.
How can I segment my audience to boost engagement effectively?
To connect with your audience more effectively, start by diving into your audience data to spot patterns like demographics, behaviors, or preferences. Look for meaningful groups, such as recently active users or high-value customers, and craft messages that resonate with their specific needs and interests. This kind of focus can significantly boost your response rates.
Be cautious about over-complicating things. Over-segmenting can lead to campaigns that are too complex to manage and may dilute their impact. Instead, stick to a few actionable segments that align with your objectives. By simplifying and refining your strategy, you can create more personalized experiences that truly engage your audience.
How does PageTest.AI simplify engagement metrics tracking and help improve decision-making?
PageTest.AI simplifies the process of monitoring engagement metrics by delivering real-time data on crucial performance indicators such as clicks, bounce rate, time on page, scroll depth, and user behavior.
The platform’s easy-to-understand visualizations and behavior flow tracking make it simple to spot which content versions resonate most with your audience. This empowers you to make informed decisions and fine-tune your website for better performance.
Related posts
say hello to easy Content Testing
try PageTest.AI tool for free
Start making the most of your websites traffic and optimize your content and CTAs.
Related Posts

![]() 30-03-2026
30-03-2026
 Ian Naylor
How Internal Links Boost Conversions
Strategic internal links guide users, improve SEO, and turn site navigation into measurable conversion growth.

![]() 28-03-2026
28-03-2026
Ian Naylor
Core Web Vitals Benchmarks by Industry
Industry Core Web Vitals benchmarks and practical fixes for LCP, INP, and CLS, plus mobile vs desktop gaps and optimization tips.

![]() 26-03-2026
26-03-2026
Ian Naylor
How to Benchmark Mobile Retention Rates
Benchmark Day 1/7/30 retention, run cohort analysis, and optimize onboarding, habit triggers, and personalization to improve app retention.