

How Cognitive Load Impacts Conversion Rates
How Cognitive Load Impacts Conversion Rates
![]() 16-02-2026 (Last modified: 16-02-2026)
16-02-2026 (Last modified: 16-02-2026)
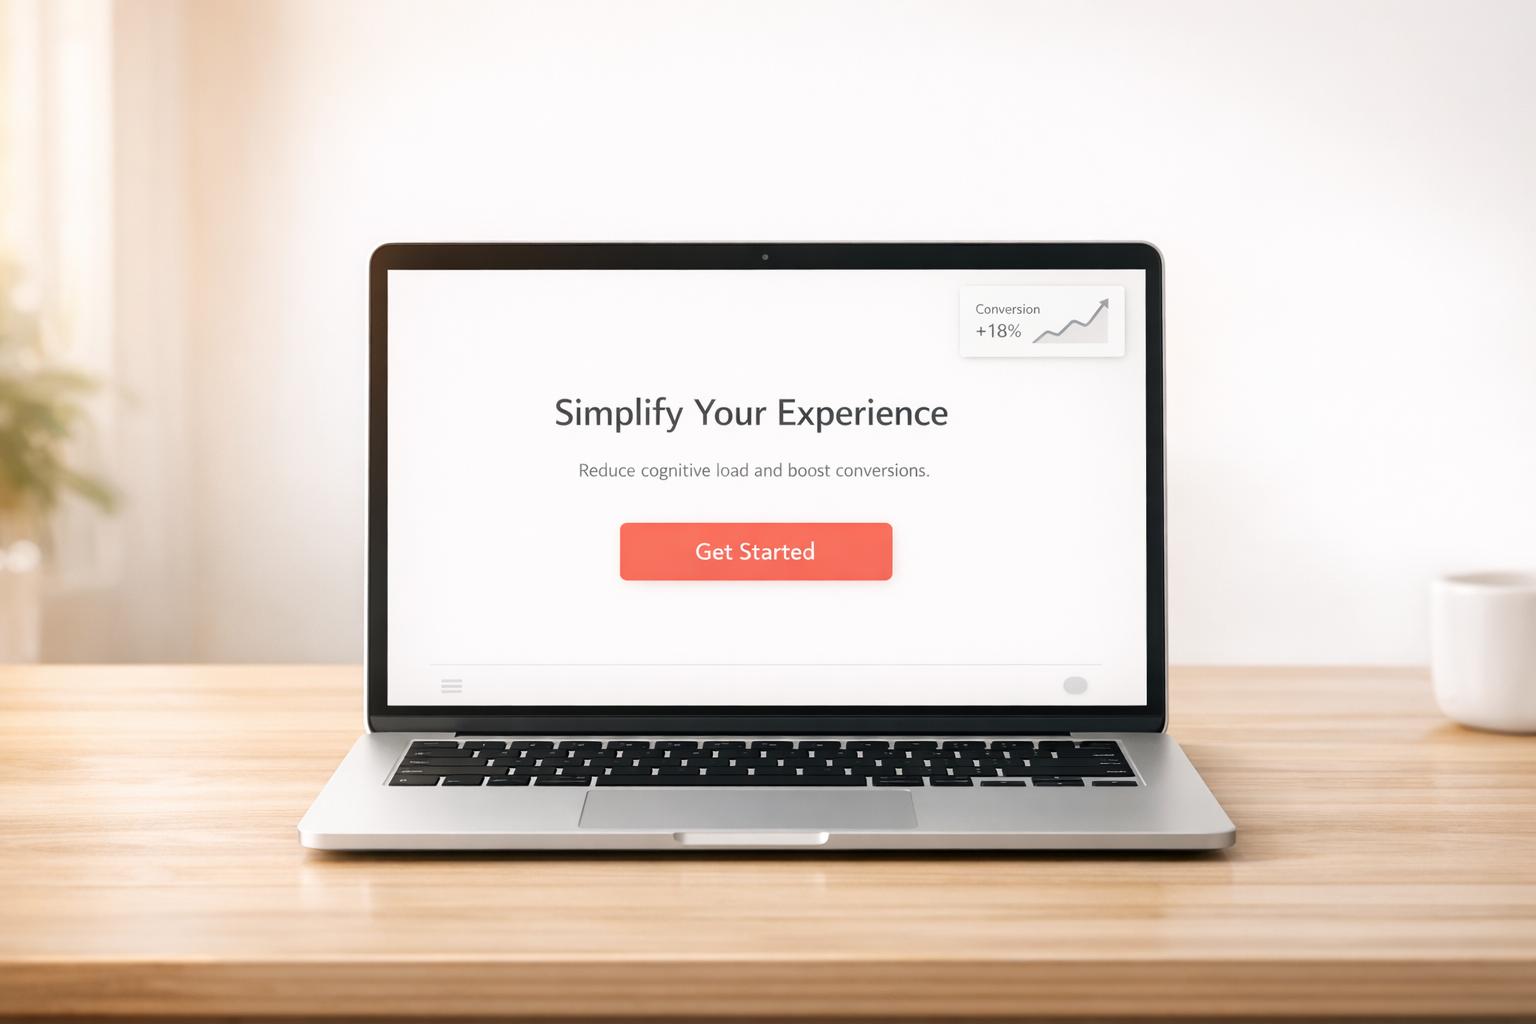
When your website demands too much mental effort, it can hurt conversions. This mental effort, known as cognitive load, affects how users process information, make decisions, and complete tasks. Here’s what you need to know:
- Excessive cognitive load leads to frustration and abandonment. For example, 18% of users abandon carts due to complex checkouts, costing businesses billions annually.
- Simpler designs improve conversions. Reducing distractions and unnecessary steps can increase conversion rates by up to 35.26%.
- Three types of cognitive load matter:
- Intrinsic: Task complexity (e.g., booking a flight vs. buying a t-shirt).
- Extraneous: Poor design choices like cluttered layouts or unclear CTAs.
- Germane: Productive mental effort that helps users understand and decide.
Research shows that reducing mental friction improves user experience and drives sales. For example, simplifying navigation or checkout processes has resulted in conversion boosts of up to 40%. Tools like heatmaps, A/B testing, and metrics like task completion time can help identify and fix problem areas.
“We’ve seen pages with more information, more features, and more CTAs actually convert worse. When cognitive load increases, hesitation increases, showing that simpler pages consistently reduced friction and improved conversions.” Ian Naylor, Founder at PageTest.ai
The bottom line? Make decisions easier for users by removing unnecessary complexity.
Reduce Cognitive Load for Better Conversion
What is Cognitive Load Theory?
Cognitive Load Theory (CLT), introduced by John Sweller in the 1980s, focuses on how our working memory processes and retains new information. According to this theory, working memory can only handle 2 to 4 pieces of information at a time, and it retains these for about 20 seconds.
When websites overwhelm working memory, users struggle to process information, make decisions, or complete tasks. By understanding the three types of cognitive load, you can identify areas where your site might be creating unnecessary obstacles for users. These three types – intrinsic, extraneous, and germane – each play a role in shaping the user experience.
Intrinsic Cognitive Load
This type of load stems from the natural complexity of a task or information. For instance, booking a multi-leg flight is inherently more demanding than purchasing a t-shirt. Similarly, configuring a custom software package requires more mental effort than signing up for a newsletter. While intrinsic load can’t be entirely removed, it can be managed. Techniques like progressive disclosure – breaking down complex information into smaller, manageable steps – can make tasks feel less overwhelming.
Extraneous Cognitive Load
Extraneous load arises from poor design choices that unnecessarily complicate user interactions. Cluttered layouts, confusing navigation, or unclear buttons force users to focus on figuring out how to use your site rather than engaging with its content. Steve Krug, author of Don’t Make Me Think, summed it up perfectly:
“As a user, I should never have to devote a millisecond of thought to whether things are clickable – or not.” – Steve Krug, Author
Research from Columbia Business School supports this, showing that while a few key benefits can boost purchase likelihood, presenting more than 3 to 4 benefits actually reduces conversions. Elements like excessive images, vague labels, or multiple competing calls-to-action (CTAs) can overwhelm users, leading to frustration and abandonment.
Germane Cognitive Load
Germane load refers to the mental effort users invest in understanding your product or service. This type of effort is productive, as it helps users form schemas – mental structures that organize and store new information for future use. By reducing extraneous load, you free up users’ mental bandwidth, allowing them to focus on learning about your offering, comparing options, and gaining confidence in their decisions. This sense of cognitive ease encourages users to engage more deeply and complete desired actions.
| Type of Cognitive Load | Source | Impact on User Experience |
|---|---|---|
| Intrinsic | Task complexity | Effort required to understand the core product or task. |
| Extraneous | Interface design | Causes confusion and frustration, leading to abandonment. |
| Germane | Schema building | Encourages understanding and confident decision-making. |
“In our experience, reducing cognitive load often means removing ‘smart’ language. Clear, direct messaging almost always outperformed creative but abstract copy.” Becky Halls, Strategist at PageTest.ai
How Cognitive Load Affects Conversion Rates: Research Findings
The relationship between cognitive load and conversion rates isn’t just a hypothesis – there’s solid research showing how mental effort influences whether users complete purchases or abandon their carts. When websites overwhelm users, they often delay decisions or leave altogether.
Behavioral Choice Studies
Research on decision-making highlights a key trend: when cognitive load is high, people tend to defer choices. Instead of selecting an option, they either postpone their decision or avoid it entirely. For instance, in one study, 43% of business respondents admitted their decisions were delayed or negatively impacted by “analysis paralysis” caused by too much information.
When users’ mental resources are stretched thin, they shift from analytical thinking to quicker, instinctive judgments. This often means relying on the first product they see or the most obvious feature rather than carefully weighing all options. Essentially, high cognitive load “switches” the brain to fast, intuitive thinking, limiting the ability to process information logically. In fact, research suggests that 95% of purchase decisions are driven by subconscious, fast-thinking processes.
When websites push beyond what the brain can handle, users experience what’s called “cognitive tunneling.” This means they focus only on the primary task at hand, overlooking important details like trust signals or secondary product benefits. As Nicholas Carr, author of The Shallows, explains:
“When the load exceeds our mind’s ability to process and store it, we’re unable to retain the information or to draw connections with other memories… Our ability to learn suffers, and our understanding remains weak”.
These patterns of behavior directly influence measurable outcomes in user experience (UX) and conversion performance.
UX Performance Data
Real-world data clearly demonstrates how cognitive load affects conversion rates. For example, a 2025 Baymard Institute survey found that improving checkout design can boost conversion rates by 35.26%. One of the biggest obstacles? Cognitive friction. Features like mandatory account creation lead to 19% of users abandoning their carts.
Practical examples reinforce this connection. In a two-week campaign for Empire Flippers, optimization firm Convertica redesigned a complicated form, replacing text-entry fields (which require users to recall information) with clickable options (which rely on recognition). They also added a sequence map to show progress. The result? A 40.16% increase in lead capture conversions. Similarly, Starbucks reported in March 2025 that mobile orders now account for 31% of transactions at U.S. company-operated stores. This success is attributed to a user-friendly design featuring one-tap reordering, AI-powered personalization, and auto-saved payment details.
High cognitive strain doesn’t just affect usability – it erodes trust. As Neal Cole, an optimization consultant, points out:
“The danger here is that cognitive strain creates sufficient uncertainty and negative feelings about a site… that visitors will not feel comfortable enough to sign up or make a transaction”.
This lack of trust is a key factor in cart abandonment. In fact, 19% of shoppers leave their carts because they don’t trust the site with their credit card information – a problem often tied to poor UX and unnecessary cognitive load.
Case Studies: Reducing Cognitive Load in Ecommerce
Simplified Checkout Processes
Streamlining the checkout process can significantly boost conversions. For instance, a multi-brand gift card retailer conducted a 22-day test where they simplified their checkout header. They kept only a logo and a sign-in link, removing all navigation menus and extra icons. The result? A 4.9% increase in conversions and an 18% rise in revenue. By eliminating distractions, users stayed focused on completing their purchases.
In another example, a men’s fashion retailer optimized their mobile checkout process by reducing the number of clicks required to make a purchase from three to just one. This adjustment led to a 5% increase in conversions. Fewer steps mean less mental effort for users, making it easier for them to follow through with their purchases.
These examples demonstrate how simplifying checkout processes can reduce cognitive load and encourage users to complete their transactions.
Streamlined Navigation and Content
Clear and straightforward navigation can make a huge difference in user behavior. A retailer specializing in Indian ethnic wear revamped their product pages by introducing automatic price updates for different product options, eliminating the need for customers to calculate costs manually. They also removed distracting social media icons. These changes resulted in a 34% increase in conversions.
Another effective strategy is removing navigation bars from checkout pages. One test revealed that creating a “distraction-free” checkout – stripping away headers and footers – led to a 10% increase in checkout completion rates and a 19.95% boost in revenue per visit. Without other links or options to divert their attention, users are more likely to stay focused and finish their transactions.
These examples highlight how simplifying navigation and reducing unnecessary elements can help users stay on track, improving both conversions and revenue.
“On mobile especially, cognitive overload becomes obvious fast. We’ve seen long scrolling pages perform better once sections were broken into clearer visual blocks.” Becky Halls, Strategist at PageTest.ai
sbb-itb-6e49fcd
Measuring Cognitive Load’s Impact Using Key Metrics
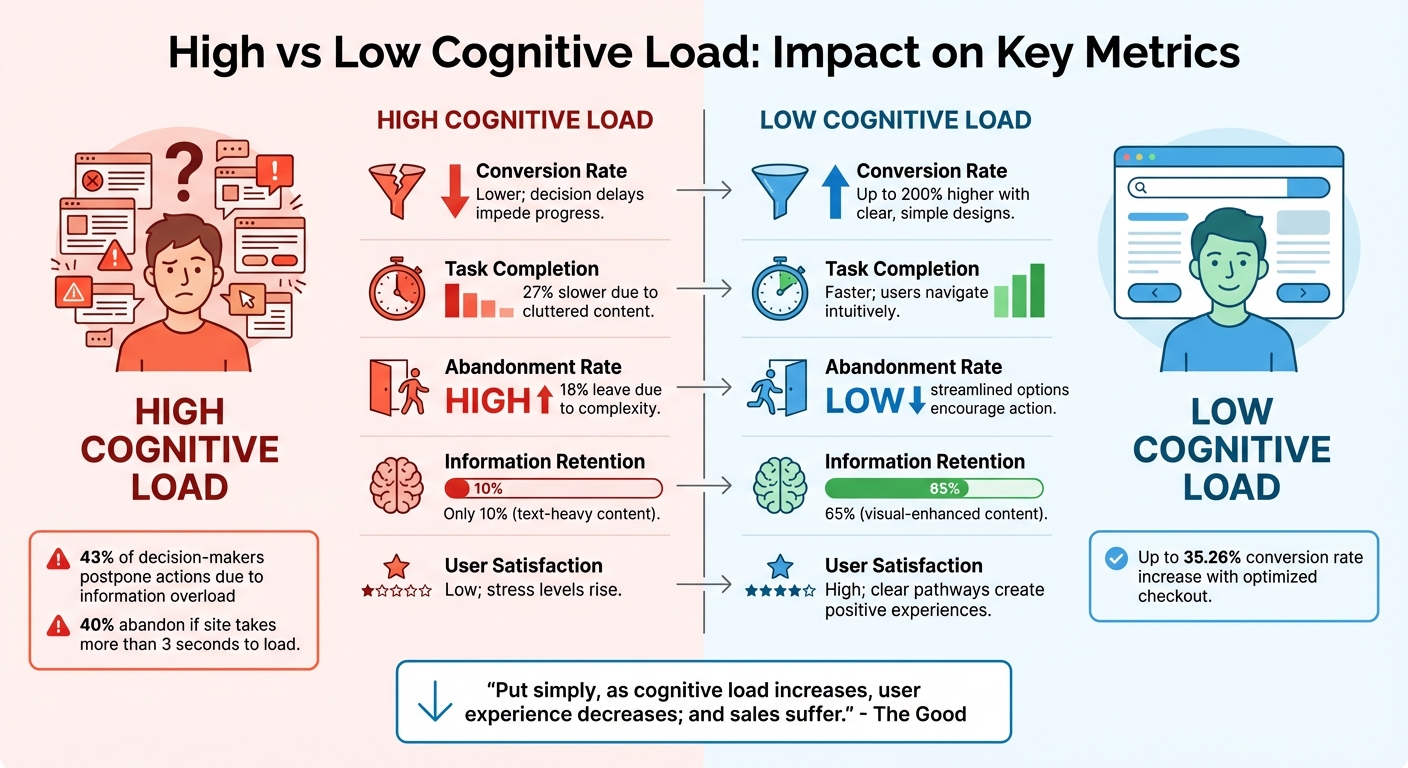
High vs Low Cognitive Load Impact on Conversion Metrics
Key Metrics for Evaluation
To understand how cognitive load impacts conversion rates, it’s essential to track metrics that highlight user experience challenges. One such metric is Task Completion Time (TCT), which measures how long users take to complete tasks. Longer completion times often indicate higher cognitive load. Another method, dual-task testing, assesses reaction times while users handle a secondary task, uncovering whether the primary task is too demanding.
The flow abandonment rate is another critical metric, showing the percentage of users who exit at specific steps in a process. High abandonment often signals tasks that feel too lengthy or complex. Heat mapping offers visual insights into user behavior – scattered clicks suggest confusion, while focused interactions indicate users know what to do.
For subjective feedback, the NASA Task Load Index (NASA-TLX) evaluates mental demand, effort, and frustration on a 100-point scale. Studies, like those on online bookstores, show strong connections between NASA-TLX scores, task completion time, and user satisfaction. Additionally, tracking support ticket volume can reveal if your interface is creating unnecessary hurdles. A rise in “how-to” questions often points to excessive mental demands.
“Put simply, as cognitive load increases, user experience decreases; and sales suffer.” – The Good
These metrics provide a clear picture of how cognitive load can shape user behavior and, ultimately, performance outcomes.
High vs. Low Cognitive Load Comparison
By using these metrics, you can directly compare the effects of high and low cognitive load on user behavior and conversion rates. For instance, websites with optimized checkout designs that minimize cognitive load have seen conversion rate increases of 35.26%. On the other hand, excessive cognitive load leads to delays in decision-making – 43% of decision-makers postpone actions due to information overload. High load also drives users away, with 40% abandoning a site if it takes more than 3 seconds to load, as working memory can only retain information for 15–30 seconds.
| Metric | High Cognitive Load | Low Cognitive Load |
|---|---|---|
| Conversion Rate | Lower; decision delays impede progress | Up to 200% higher with clear, simple designs |
| Task Completion | Slower by 27% due to cluttered content | Faster; users navigate intuitively |
| Abandonment Rate | High; 18% leave due to complexity | Low; streamlined options encourage action |
| Information Retention | 10% (text-heavy content) | 65% (visual-enhanced content) |
| User Satisfaction | Low; stress levels rise with high load | High; clear pathways create positive experiences |
While reducing cognitive load can significantly improve these metrics, it’s also worth keeping an eye on “guardrail” metrics like retention rate and average sale amount. These ensure that simplifying processes doesn’t inadvertently attract less-qualified leads.
Strategies to Measure and Reduce Cognitive Load
User Testing and Feedback
To truly understand where your design might be overwhelming users, direct testing is a game-changer. Watching real users interact with your site can reveal moments of confusion or frustration. Start with a cognitive audit spreadsheet – log each page’s reading requirements, memory demands, and decision points. This structured approach helps pinpoint areas that need simplification or removal.
Pay close attention to how much your design relies on on-screen instructions. If users need explanations to figure out the interface, it’s a warning sign. Steve Krug puts it best:
“The main thing you need to know about instructions is that no one is going to read them – at least not until after repeated attempts at ‘muddling through’ have failed”.
The goal? A design so intuitive that instructions become unnecessary.
Tools like heatmaps and session replays are also invaluable. Heatmaps highlight where users mistakenly click on non-interactive elements, while session replays show moments of hesitation, backtracking, or task abandonment. Platforms like Attention Insight even offer a Cognitive Load Score, quantifying the mental effort your design demands.
Take this case study: a company replaced text-entry fields with clickable options and added a progress map. The result? A 40.16% boost in conversions. It’s a clear example of how addressing friction points can directly impact performance.
These qualitative insights work alongside metrics to show how reducing cognitive load can transform user experience – and your bottom line.
A/B Testing with PageTest.AI
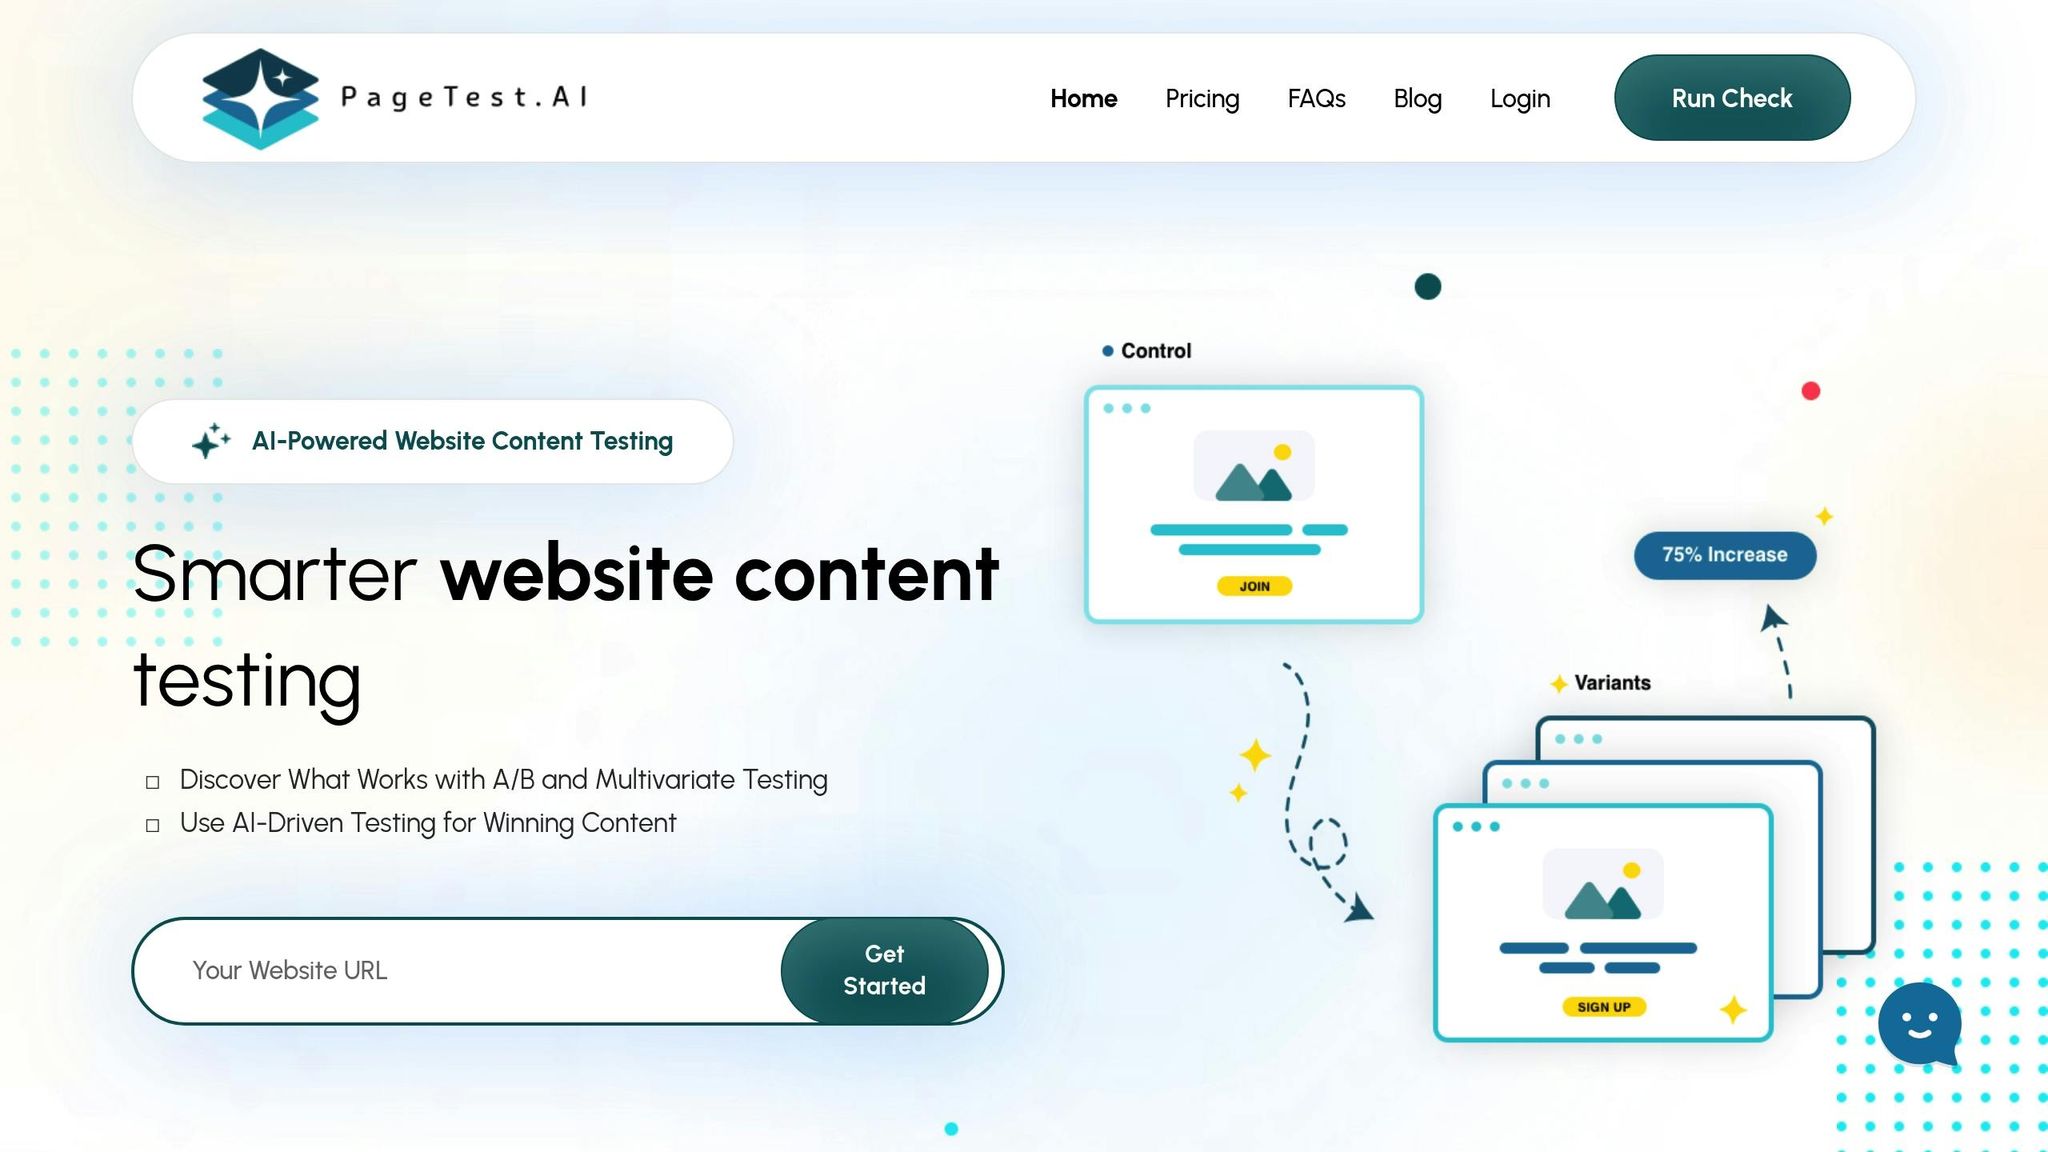
Once you’ve identified problem areas, A/B testing can confirm which changes actually make a difference. The trick is to test one element at a time – like a headline, call-to-action (CTA), or image – so you can isolate its effect on user experience. Tools like PageTest.AI make this process easier. With its no-code Chrome extension, you can create and test variations without needing technical skills.
PageTest.AI tracks both primary metrics (like conversion rates) and guardrail metrics (such as bounce rates and retention). This ensures that improving one area doesn’t unintentionally create issues elsewhere. For instance, you could test whether a more specific CTA like “Start Your Free Trial” performs better than a generic “Sign Up” button.
Run your tests for 1–2 weeks to gather reliable user behavior data. Keep in mind, though, that only about 1 in 7 A/B tests yield a winning variation. Your chances improve when you base tests on solid, data-driven hypotheses. PageTest.AI also tracks clicks, engagement, time on page, and scroll depth, giving you a clear picture of how cognitive load shifts with each tweak.
Once you identify winning changes, you can implement them widely and build on proven design principles.
Design Best Practices
Some design principles consistently help reduce mental strain. Start by sticking to familiar standards – a magnifying glass for search, a cart icon for shopping – so users don’t need to relearn navigation basics. Use recognition over recall by incorporating features like autosuggest, autocomplete, and “recently viewed” sections. These tools minimize the need for users to remember specific details.
Break information into manageable chunks. Think credit card numbers split into four-digit groups or product descriptions neatly organized under headings. This approach aligns with short-term memory limits, which can handle only 5 to 9 items at a time.
Another tip? Use smart defaults. Pre-select common choices, like the user’s country or the most popular shipping method, to reduce decision fatigue.
Steve Krug’s advice here is spot-on:
“It doesn’t matter how many times I have to click, as long as each click is a mindless, unambiguous choice.”
To make actions even clearer, focus each page on a primary goal. Use negative space and contrasting colors to draw attention to the main CTA. Walgreens, for example, achieved one of the lowest bounce rates in ecommerce by optimizing site speed to just 0.522 seconds. This ensured that users could access information within the 15–30 second window their working memory retains data. Grouping content into clearly labeled sections also speeds up task completion by 27%.
Conclusion
Excessive mental effort can be a conversion killer. When a website overwhelms users with too much to process, they may hesitate, lose trust, and ultimately abandon their carts. Research highlights that while about 95% of purchase decisions happen through quick, subconscious processes, a high cognitive load forces users into slower, more deliberate decision-making modes – often leading to drop-offs.
The evidence and case studies discussed earlier clearly show that simplifying user experiences boosts conversions. Streamlined checkout processes, for example, have been shown to significantly increase conversion rates, presenting a huge opportunity for e-commerce businesses to recover otherwise lost sales.
“As cognitive load increases, user experience decreases; and sales suffer.” – David Hoos, Director of Marketing, The Good
To make impactful improvements, tools like PageTest.AI can be invaluable. With its no-code Chrome extension, you can easily test variations of headlines, CTAs, and other key elements. The platform tracks metrics like clicks, engagement, time on page, and scroll depth, delivering actionable data on how each change affects both cognitive load and conversions.
Streamlining the decision-making process is essential. Start by reviewing your highest-traffic pages, looking for points where users might get stuck in unnecessary “read, remember, decide” loops. Simplify those areas and use A/B testing to find what works best. Keep in mind that 43% of business respondents have reported delays or negative impacts on decisions due to analysis paralysis. The goal? Make decisions effortless for your users.
How Cognitive Load Impacts Conversion Rates – FAQs
How can I tell if cognitive load is hurting my conversions?
If your site has high bounce rates, low engagement, or a disjointed user flow, it might point to a problem with cognitive load. These are clear indicators that visitors could feel overwhelmed by the information or design, leading them to abandon your site before taking any meaningful action.
By identifying and addressing these issues, you can create a more intuitive experience, keeping users engaged and boosting your conversion rates.
What site changes reduce cognitive load the fastest?
To quickly ease cognitive load on a website, prioritize simplicity. Keep information straightforward, cut out any fluff, and ensure content is predictable and easy to skim. Use clear layouts, short, to-the-point text, and smooth, intuitive navigation. These tweaks not only enhance the user experience but can also lead to better conversion rates.
How do I A/B test cognitive-load fixes without hurting revenue?
To test ways to reduce cognitive load without jeopardizing revenue, start with small, data-backed adjustments that streamline the user experience. Tools like PageTest.AI can help you experiment with specific elements – think headlines, form fields, or calls-to-action – while keeping the original version as a baseline for comparison. Keep an eye on key metrics like conversion rates and engagement levels to measure impact. Roll out winning changes step by step to enhance the user experience while safeguarding your revenue streams.
How Cognitive Load Impacts Conversion Rates – Related Blog Posts
say hello to easy Content Testing
try PageTest.AI tool for free
Start making the most of your websites traffic and optimize your content and CTAs.
Related Posts

![]() 30-03-2026
30-03-2026
 Ian Naylor
How Internal Links Boost Conversions
Strategic internal links guide users, improve SEO, and turn site navigation into measurable conversion growth.

![]() 28-03-2026
28-03-2026
Ian Naylor
Core Web Vitals Benchmarks by Industry
Industry Core Web Vitals benchmarks and practical fixes for LCP, INP, and CLS, plus mobile vs desktop gaps and optimization tips.

![]() 26-03-2026
26-03-2026
Ian Naylor
How to Benchmark Mobile Retention Rates
Benchmark Day 1/7/30 retention, run cohort analysis, and optimize onboarding, habit triggers, and personalization to improve app retention.