

Real-Time Metrics for CRO: What to Track

Real-Time Metrics for CRO: What to Track
![]() 10-03-2026 (Last modified: 10-03-2026)
10-03-2026 (Last modified: 10-03-2026)
Real-time metrics for CRO are essential for optimizing your website’s performance and improving conversions. By tracking key metrics like conversion rate (CVR), click-through rate (CTR), bounce rate, average time on page, and cart abandonment rate, you can identify problems and make quick adjustments to improve results. Tools like PageTest.AI simplify this process with no-code testing, instant insights, and actionable dashboards.
Key Metrics to Monitor:
- Conversion Rate (CVR): Measures the percentage of visitors completing desired actions. Formula:
(Conversions / Visitors) × 100. - Click-Through Rate (CTR): Tracks how effectively ads or CTAs generate clicks. Formula:
(Clicks / Impressions) × 100. - Bounce Rate: Shows the percentage of visitors leaving after viewing one page. Formula:
(Single-Page Sessions / Sessions) × 100. - Average Time on Page: Indicates how long visitors stay engaged with your content.
- Cart Abandonment Rate: Tracks users who add items to their cart but don’t complete purchases. Formula:
(Carts Abandoned / Started Checkouts) × 100.
Quick Tips for Improvement:
- Use A/B tests to refine CTAs, headlines, or layouts.
- Personalize content to resonate with your audience.
- Address technical issues like slow load times or poor mobile design.
- Simplify the checkout process to reduce abandonment.
Tools like Google Analytics 4 (GA4) and PageTest.AI provide the data you need to monitor performance and make informed decisions. With segmentation strategies (e.g., device type, traffic source, user behavior), you can target specific issues and optimize effectively.
Want faster results? Try PageTest.AI’s free trial to test and track CRO metrics in real time without needing a developer.
10 CRO Metrics That Will Skyrocket Your Conversions
sbb-itb-6e49fcd
Core Real-Time Metrics to Track
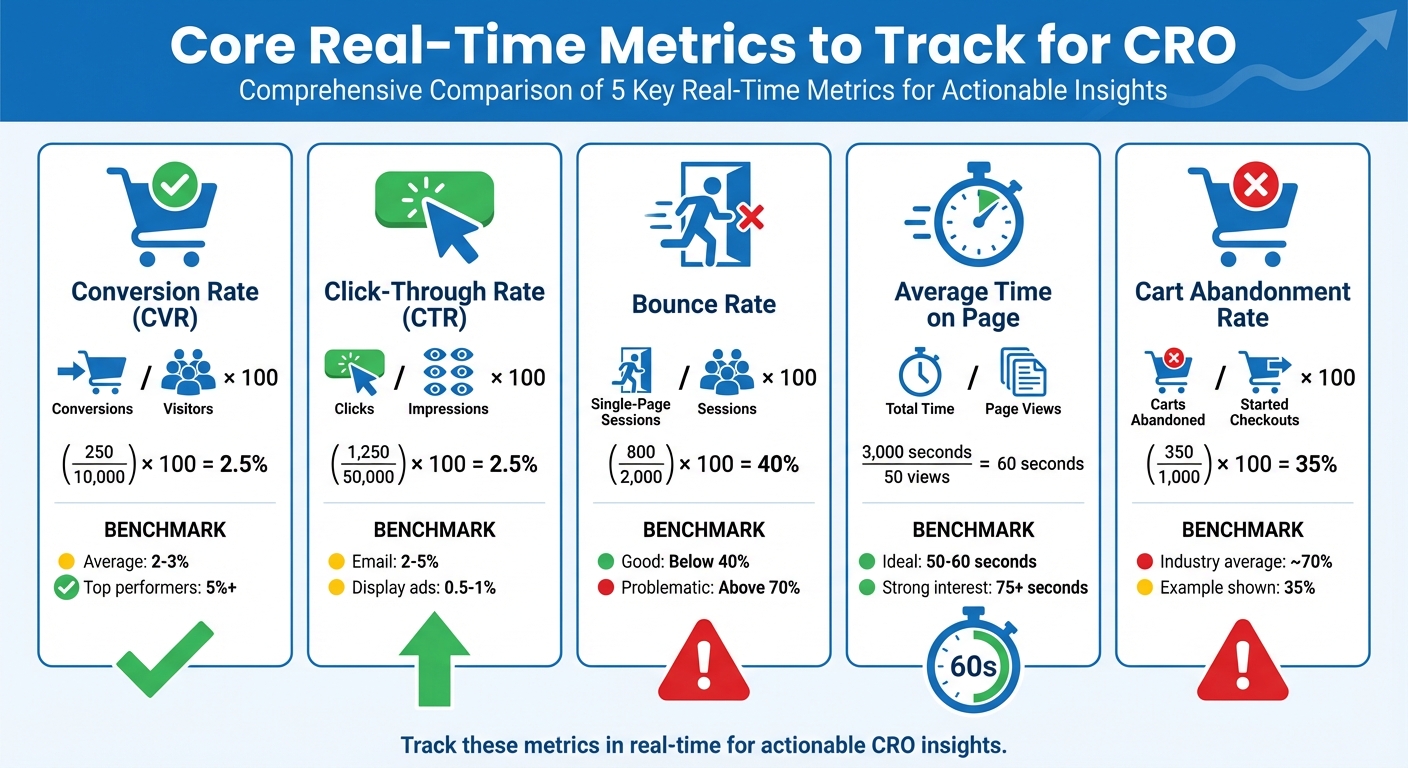
5 Essential CRO Metrics: Formulas, Examples, and Benchmarks
Focusing on the right metrics can turn guesswork into actionable insights. Here’s a breakdown of key metrics, their formulas, real-life examples, and tips to improve performance.
Conversion Rate (CVR)
Conversion rate measures the percentage of visitors who complete a desired action, such as making a purchase or signing up for a trial. Here’s the formula:
(Number of Conversions / Total Number of Visitors) × 100 = CVR%.
For example, if your e-commerce site gets 10,000 visitors in a month and 250 make a purchase, the CVR is (250 / 10,000) × 100 = 2.5%. Similarly, if a SaaS landing page has 5,000 visitors and 150 trial sign-ups, the CVR would be (150 / 5,000) × 100 = 3.0%. Most e-commerce sites achieve CVRs between 2% and 3%, while top performers can exceed 5%.
To increase site conversion, experiment with different headlines, calls-to-action (CTAs), and layouts. Real-time tracking helps you quickly identify which changes boost performance.
Click-Through Rate (CTR)
Click-through rate shows how effectively your ads, links, or CTAs attract clicks compared to total impressions. Formula:
(Number of Clicks / Total Number of Impressions) × 100 = CTR%.
For instance, if an ad generates 50,000 impressions and 1,250 clicks, the CTR is (1,250 / 50,000) × 100 = 2.5%. Email campaigns often see CTRs between 2% and 5%, while display ads average around 0.5% to 1%. A higher CTR indicates that your messaging resonates with the audience.
Boost CTR by personalizing ad copy, using action-driven language like “Claim Your Discount Today”, and making CTAs visually distinct. Testing multiple variations simultaneously can reveal what drives the most engagement.
Bounce Rate
Bounce rate reflects the percentage of visitors who leave after viewing only one page. Formula:
(Single-Page Sessions / Total Sessions) × 100 = Bounce Rate%.
For example, if a landing page gets 2,000 visitors and 800 leave after one page, the bounce rate is (800 / 2,000) × 100 = 40% – a reasonable level. Rates above 70% often signal problems like slow loading times, irrelevant content, or poor navigation.
To reduce bounce rates, focus on faster load times (aim for under 3 seconds), clearer CTAs, and mobile-friendly designs. Real-time monitoring can help identify underperforming pages, allowing you to test improvements like repositioning CTAs or simplifying layouts.
Average Time on Page
This metric shows how long visitors stay engaged with your content. It’s calculated by dividing the total time spent on a page by the number of views. Industry benchmarks suggest 50–60 seconds is a solid engagement level.
If your average time on page is below 50 seconds, it may indicate weak content. On the flip side, 75+ seconds suggests strong interest. To improve, grab attention immediately with clear headings, use bullet points for readability, and include interactive elements like videos or polls. Pairing this metric with scroll depth can pinpoint where visitors lose interest.
Cart Abandonment Rate
Cart abandonment rate tracks the percentage of users who add items to their cart but fail to complete the purchase. Formula:
(Carts Abandoned / Started Checkouts) × 100 = Abandonment Rate%.
For example, if 1,000 users add items to their cart but only 650 complete the purchase, the abandonment rate is (350 / 1,000) × 100 = 35%. In e-commerce, average abandonment rates hover around 70%, representing a major revenue gap.
To address this, analyze where users drop off – whether it’s high shipping costs, limited payment options, or lengthy forms. Simplify the checkout process, add trust signals, offer multiple payment methods, and use exit-intent popups to recover potential sales.
| Metric | Formula | Example (US Format) | Benchmark |
|---|---|---|---|
| CVR | (Conversions / Visitors) × 100 | (250 / 10,000) × 100 = 2.5% | 2–3% average, 5%+ top-tier |
| CTR | (Clicks / Impressions) × 100 | (1,250 / 50,000) × 100 = 2.5% | Email: 2–5%, Display: 0.5–1% |
| Bounce Rate | (Single-Page Sessions / Sessions) × 100 | (800 / 2,000) × 100 = 40% | Below 40% good, above 70% problematic |
| Avg Time on Page | Total Time / Page Views | 3,000 seconds / 50 views = 60 seconds | 50–60 seconds ideal |
| Cart Abandonment | (Carts Abandoned / Started Checkouts) × 100 | (350 / 1,000) × 100 = 35% | Around 70% average |
Beyond these metrics, keep an eye on others like exit rate, pages per session, form completion rates, and revenue per visitor. Together, they give a clear snapshot of your conversion funnel’s performance in real time.
PageTest.AI brings all these metrics into one platform, offering role-specific dashboards for instant insights. Whether you’re tracking CTR for a new campaign or examining bounce rates across devices, real-time data lets you act quickly on opportunities and challenges alike.
How to Monitor These Metrics
Google Analytics 4 (GA4) offers real-time tracking of website activity within a 30-minute rolling window, ensuring that tracking tags are functioning properly. This provides a solid starting point for campaign-specific monitoring.
Once your campaign is live, you can confirm UTM parameters by checking the “Users by First User Source/Medium/Campaign” card. For debugging conversion funnels, the “View user snapshot” feature is especially useful. It allows you to follow an individual user’s event sequence, helping to pinpoint drop-off points in multi-step processes like checkouts. By cycling through multiple user snapshots, you can gather broader insights.
When testing new elements, such as call-to-action (CTA) buttons, the “Events by Event Name” card is key. For instance, if you’re testing a “request_demo” button, you can confirm that the associated tags fire correctly by interacting with the page in an incognito window. GA4 also automatically tracks events like “scroll” when a user reaches 90% of the page’s depth.
While GA4 provides a strong foundation for tracking, tools like PageTest.AI take monitoring to the next level by focusing on element-specific performance. Using real-time data, PageTest.AI tracks impressions and clicks, offering instant insights through its dashboard and Chrome extension. Color-coded cues – green for top performers, red or pink for underperformers, and a gold trophy for statistically significant winners – make it easy to interpret results. For example, a PageTest.AI test revealed a CTA variant that boosted clicks by 306%.
GA4 also supports side-by-side analysis, enabling comparisons across different data subsets, such as device categories or age groups. These comparisons work well alongside the real-time insights provided by PageTest.AI. With PageTest.AI’s URL filters, you can zero in on the performance of specific pages or campaigns, prioritizing tests that need to reach statistical significance faster.
For WordPress users, MonsterInsights (Plus plan or higher) simplifies monitoring by displaying real-time analytics directly within the WordPress dashboard.
Filtering and Segmentation Methods
Raw metrics tell you what’s happening, but segmentation helps you understand why. By breaking down data into segments, you can uncover patterns that would otherwise stay hidden. Paul Bernier, VP of Product Management at SiteSpect, sums it up well:
“Segmenting audiences by behavior reveals insights that aggregated data obscures”.
This approach lays the groundwork for more effective, targeted segmentation strategies.
Start with device segmentation to identify technical issues. It’s a straightforward entry point – mobile users, for instance, often encounter unique challenges like slower load times, smaller tap targets, or forms that don’t auto-fill correctly. Analytics platforms usually make it easy to filter by device type, helping you spot and address these friction points.
Next, traffic source segmentation can highlight which channels attract the most valuable visitors. Organic search traffic behaves differently from users coming through paid ads, social media, or email campaigns. By breaking down metrics by source – such as Organic, Paid, Social, or Referral – you can see which platforms drive meaningful conversions and refine your strategy to focus on the most effective ones.
Behavioral segmentation takes a closer look at user actions rather than demographics. Tracking behaviors like rage clicks, repeat visits, or specific navigation paths can help you identify areas where users are struggling. While setting up custom events and analyzing session data can take time, the rewards are worth it: behavioral segmentation has been shown to boost CTR by over 100%. Plus, personalization efforts based on these insights can lead to a 10-15% increase in revenue.
Combining these segmentation methods with real-time data can give your conversion rate optimization (CRO) efforts a sharper edge.
| Segmentation Method | Advantages | Effort Required | CRO Impact |
|---|---|---|---|
| Device Type | Highlights technical and UX issues specific to mobile vs. desktop users | Low | High |
| User Type (New vs. Returning) | Customizes messaging based on familiarity with your brand | Low | Medium |
| Traffic Source | Identifies high-intent traffic sources and improves attribution accuracy | Medium | High |
| User Intent | Provides tailored experiences based on users’ immediate goals | High | Very High |
| Behavioral (Exit/Bounce) | Pinpoints problem areas in the conversion funnel | Medium | High |
Using PageTest.AI for Real-Time Insights

With your segmentation strategy in place, it’s time to act on those insights. PageTest.AI makes this process straightforward, offering tools to turn data into action with minimal effort. Its no-code Chrome extension allows you to set up tests instantly, generate AI-powered content variations, and track performance in real time as visitors interact with your site.
The Chrome extension removes technical barriers, speeding up your conversion rate optimization (CRO) efforts. Simply point and click on any website element – whether it’s a headline, call-to-action (CTA), or button text – to launch a test immediately. As Werner Geyser, Founder of Influencer Marketing Hub, says:
“I love that you have a chrome extension, it makes it so much easier!”
This instant setup is especially helpful for addressing sudden changes in key metrics like click-through rates (CTR) or bounce rates across devices.
PageTest.AI’s AI engine takes it further by generating up to 10 content variations for each selected element. These options are based on real conversion data, ensuring they’re optimized for performance. You can deploy these variations right away in A/B or multivariate tests, while a live dashboard tracks essential metrics – such as clicks, engagement, time on page, and scroll depth. The system uses color-coded indicators to simplify analysis: green for successful variants, red for underperformers, and a gold trophy for statistically significant winners. Plus, it integrates smoothly with your existing tools.
Speaking of integration, PageTest.AI works effortlessly with platforms like WordPress, Shopify, and Wix through a single asynchronous script that won’t slow down your site.
Here’s a breakdown of the pricing plans:
| Plan | Price | Test Impressions/Month | Websites | Key Limitations |
|---|---|---|---|---|
| Trial | $0 | 10,000 | 1 | 5 pages, 5 tests, no team access |
| Startup | $10 | 10,000 | 1 | 10 pages, 10 tests, no video call support |
| Enterprise | $50 | 100,000 | 10 | 100 pages, 100 tests |
| Agency | $200 | 1,000,000 | 100 | Unlimited pages and tests |
For smaller sites, the Trial or Startup plans offer enough flexibility to test key elements like homepage CTAs or product page headlines. Larger operations, running multiple tests on mobile versus desktop performance or comparing paid and organic traffic, will find the Enterprise or Agency plans better suited to handle higher traffic and more complex needs. Choose the plan that aligns with your traffic volume and testing goals to stay ahead in an ever-changing market.
Real-Time Metrics for CRO – Conclusion
Real-time metrics for CRO take the guesswork out of CRO, turning it into a process driven by clear, actionable data. By keeping an eye on key indicators like conversion rate, click-through rate, bounce rate, average time on page, and cart abandonment rate, you can pinpoint exactly where users drop off. This means no more sweeping redesigns – just targeted updates that make a real difference.
But the real magic happens when you dive deeper with audience segmentation. Breaking down data by device type, traffic source, or user behavior can reveal issues that might go unnoticed in overall averages. For instance, mobile users might struggle with checkout, even if the desktop experience looks fine. Addressing these specific pain points leads to better results than broad, one-size-fits-all changes.
These insights lay the foundation for tools that make optimization easy and efficient. Enter PageTest.AI – a no-code Chrome extension designed to simplify CRO. With AI-generated content variations and real-time performance tracking, you can instantly test headlines, CTAs, and other elements to uncover what works best, all without impacting site speed. Plus, its flexible pricing fits everyone, from small businesses to agencies managing multiple clients.
Curious to see it in action? Try PageTest.AI for free – no credit card needed – and transform your real-time data into meaningful improvements today.
Real-Time Metrics for CRO – FAQs
How often should I check real-time CRO metrics?
To get the most out of your website, it’s important to keep an eye on real-time CRO (Conversion Rate Optimization) metrics as often as you can. Regular monitoring lets you spot trends or issues quickly, so you can make adjustments that improve performance without delay. By tracking these metrics consistently, you’ll be able to respond to shifts in user behavior and fine-tune your site for better results.
Which CRO metric should I prioritize first?
Start by focusing on your conversion rate – this is the clearest indicator of how well your website transforms visitors into paying customers or qualified leads. It’s a key metric that shows how effectively your site is performing and highlights where your conversion process might need some fine-tuning.
How do I segment real-time data to find the real issue?
To zero in on the core issue, try grouping real-time data by shared characteristics – things like device type, traffic source, or engagement levels. This approach makes it easier to spot segments that aren’t performing well, such as those with high drop-off rates or lower-than-expected conversions. Keep an eye on key metrics like conversion rates or revenue per visitor to identify areas that need attention. Additionally, setting up real-time alerts can highlight friction points instantly, giving you the chance to act quickly and improve performance.
Related Blog Posts
say hello to easy Content Testing
try PageTest.AI tool for free
Start making the most of your websites traffic and optimize your content and CTAs.
Related Posts

![]() 30-03-2026
30-03-2026
 Ian Naylor
How Internal Links Boost Conversions
Strategic internal links guide users, improve SEO, and turn site navigation into measurable conversion growth.

![]() 28-03-2026
28-03-2026
Ian Naylor
Core Web Vitals Benchmarks by Industry
Industry Core Web Vitals benchmarks and practical fixes for LCP, INP, and CLS, plus mobile vs desktop gaps and optimization tips.

![]() 26-03-2026
26-03-2026
Ian Naylor
How to Benchmark Mobile Retention Rates
Benchmark Day 1/7/30 retention, run cohort analysis, and optimize onboarding, habit triggers, and personalization to improve app retention.