

Landing Page Performance Scorecard
Landing Page Performance Scorecard
![]() 15-12-2025 (Last modified: 18-12-2025)
15-12-2025 (Last modified: 18-12-2025)
Improve Conversions with a Landing Page Performance Scorecard
If you rely on your website to generate leads or sales, your landing page is often the make-or-break moment. A landing page performance scorecard helps you understand how well that page is doing its job, giving you a quick snapshot of what’s working and what’s quietly costing you conversions.
Quick snapshot:
-
Measures conversion rate, bounce rate, and engagement in one simple score
-
Helps you see why visitors act (or don’t act) on your page
-
Identifies which elements need refinement
-
Turns analytics into clear, actionable insights
We’ve seen landing pages that looked great on the surface but struggled underneath. Once the numbers were laid out in a simple scorecard, the issues became painfully obvious – and the fixes were surprisingly quick.
Why landing page performance analysis matters
Every visitor costs you something – time, money, or effort. If they leave without taking action, that cost goes up. The goal isn’t just getting people to the page, it’s getting them to convert.
A landing page performance scorecard gives you clarity around key questions:
-
Are users sticking around long enough to understand the offer?
-
Are they clicking the CTA or scrolling past it?
-
Is the page building trust or creating friction?
Small issues add up fast. A confusing headline, weak CTA, or poor layout can quietly erode conversions. We’ve seen a landing page jump from a 1.8 percent conversion rate to 4 percent simply by adjusting the hero section and tightening the value proposition.
That’s the power of clear, measurable insights.
What the landing page performance scorecard actually measures
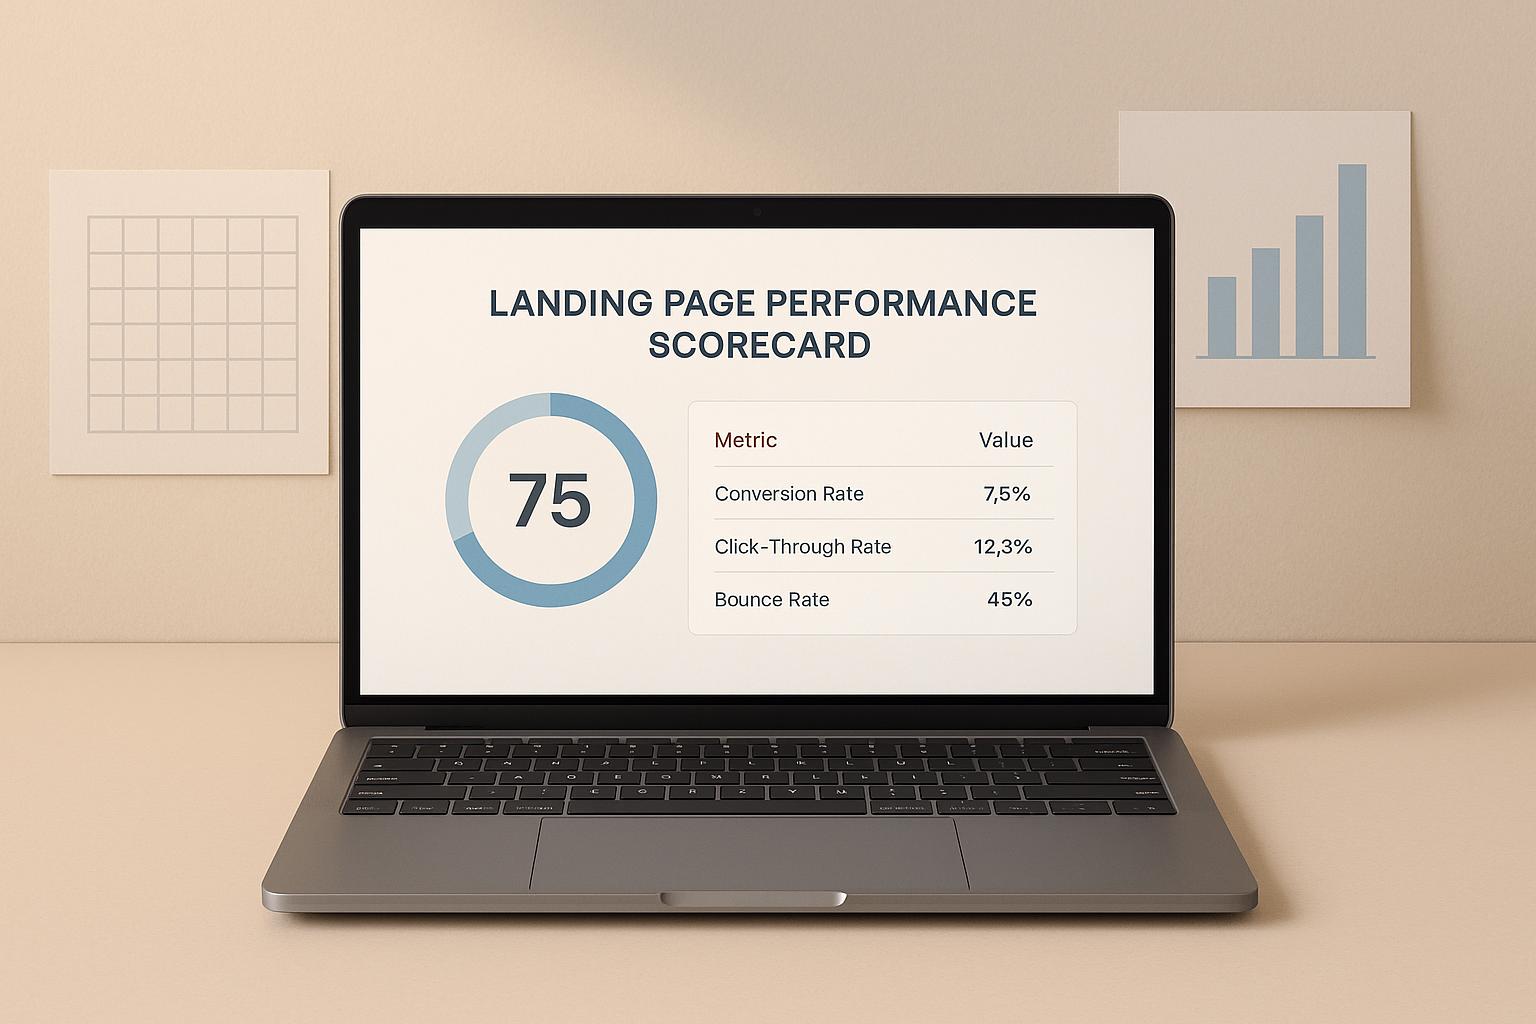
The scorecard combines three essential metrics to calculate a score out of 100:
1. Conversion Rate (40% weight)
The most important metric. If conversions are strong, the page is doing its job.
-
5% or more = excellent
-
2–5% = solid, depending on industry
2. Bounce Rate (30% weight)
Shows how many visitors leave without interacting.
-
Below 40% is generally healthy
-
Higher rates often point to mismatched messaging or slow load times
3. Average Time on Page (30% weight)
A useful indicator of interest and clarity.
-
Longer times generally mean visitors are engaged
-
Very short times often reveal confusion or low relevance
These weighted metrics create a balanced score, giving you a quick way to compare different landing pages or track improvements over time.
What metrics you need to use the scorecard
You only need four numbers:
-
Total visitors
-
Total conversions
-
Bounce rate percentage
-
Average time on page (in seconds)
You’ll find all of these in your analytics platform. Pop them into the landing page performance scorecard and you’ll instantly get:
-
Your score
-
How each metric contributed
-
Clear recommendations on what to fix first
We’ve used similar scorecards in-house to prioritise which landing pages get attention. It stops you from guessing and keeps your optimisation work focused where it moves the needle.
How to improve your landing page score
Improvements depend on which part of the score is dragging things down.
If your bounce rate is high:
-
Tighten your headline and subheading
-
Make the offer clearer above the fold
-
Improve visual hierarchy
-
Remove distractions
If your conversions are low:
-
Strengthen your CTA text
-
Clarify your value proposition
-
Add trust signals (reviews, logos, guarantees)
-
Reduce form fields or friction
If time on page is weak:
-
Break text into shorter sections
-
Add visuals, diagrams, or examples
-
Improve readability
-
Ensure the user immediately sees why the page matters
We’ve found that even small fixes – like changing CTA placement or simplifying the opening paragraph – can move a page’s score noticeably.
FAQs
How is the landing page performance score calculated?
Your score is a weighted measure of three metrics:
-
40% conversion rate
-
30% bounce rate
-
30% average time on page
Higher conversions and longer engagement improve your score, while high bounce rates pull it down.
What metrics do I need to use this tool?
You’ll need total visitors, total conversions, bounce rate, and average time on page. Once you have those numbers, the scorecard does the rest.
How can I improve my landing page score?
Identify the weakest metric, then adjust your design, messaging, and layout accordingly. After generating your score, the tool also provides tailored suggestions to help guide improvements.
say hello to easy Content Testing
try PageTest.AI tool for free
Start making the most of your websites traffic and optimize your content and CTAs.
Related Posts

![]() 30-03-2026
30-03-2026
 Ian Naylor
How Internal Links Boost Conversions
Strategic internal links guide users, improve SEO, and turn site navigation into measurable conversion growth.

![]() 28-03-2026
28-03-2026
Ian Naylor
Core Web Vitals Benchmarks by Industry
Industry Core Web Vitals benchmarks and practical fixes for LCP, INP, and CLS, plus mobile vs desktop gaps and optimization tips.

![]() 26-03-2026
26-03-2026
Ian Naylor
How to Benchmark Mobile Retention Rates
Benchmark Day 1/7/30 retention, run cohort analysis, and optimize onboarding, habit triggers, and personalization to improve app retention.