

How Latency Affects Mobile Page Speed

How Latency Affects Mobile Page Speed
![]() 17-03-2026 (Last modified: 17-03-2026)
17-03-2026 (Last modified: 17-03-2026)
When your website loads slowly on mobile, latency is often the main culprit, making mobile friendly SEO a top priority. Latency is the delay between a user’s request and your server’s response, and it can significantly impact how fast your site appears. Here’s what you need to know:
- Mobile networks are slower: 4G/LTE networks face delays of 15–100ms per request, while older 3G networks exceed 150ms. Wi-Fi, by comparison, is much faster at 1–4ms.
- Multiple requests add up: Each page resource (images, scripts, styles) requires its own round trip. For example, three requests at 300ms each add nearly a second of delay.
- Slow sites lose users: 53% of mobile users abandon pages that take over 3 seconds to load. A 1-second delay can reduce conversions by 7–20%.
- Business impact is real: Amazon estimates 100ms of latency costs them 1% of revenue. For smaller businesses, shaving a few seconds off load time can mean huge gains in sales.
To tackle latency:
- Use a Content Delivery Network (CDN) to serve content from servers closer to users.
- Optimize images with modern formats like WebP or AVIF.
- Minify and compress code to reduce file sizes.
- Test your site with tools like Google Lighthouse and WebPageTest to identify and fix bottlenecks.
Reducing latency isn’t just about speed – it’s about keeping users engaged and driving conversions. Faster sites mean happier visitors and better business results.
Optimizing the Critical Rendering Path for Instant Mobile Websites – Velocity SC – 2013
sbb-itb-6e49fcd
How Latency Affects Mobile User Behavior
Latency doesn’t just slow down your site – it actively changes how users interact with it. Waiting for more than 3 seconds can trigger measurable physiological stress responses in users. What makes this even worse is how people perceive time online. Research shows that perceived waiting time in digital environments feels about 36% longer than the actual wait. That means if your page takes 3 seconds to load, users feel like they’ve waited over 4 seconds. Combine this with the fact that the average online attention span has dropped to just 8 seconds, and you’ve got a very small window to grab and keep their attention.
"The speed of response is a subconscious trigger that shapes brand perception before any conscious evaluation of content can occur. It’s the digital equivalent of a firm handshake".
These stress responses affect user engagement directly, leading to higher bounce rates and fewer conversions.
Latency and Mobile Bounce Rates
The impatience caused by slow load times often shows up as increased bounce rates. And the relationship between latency and abandonment isn’t gradual – it accelerates. The steepest drop in user retention happens between 2 and 3 seconds. For example, bounce rates jump from 7% at 1 second to a staggering 82% at 5 seconds.
Take this real-world case: In 2025, a multi-brand fashion retailer worked with WebBoost to cut their mobile load time from 5.3 seconds to 2.1 seconds. The results? Their mobile bounce rate dropped from 76% to 41%, and their mobile conversion rate skyrocketed by 188% – rising from 0.8% to 2.3%. This improvement brought in an extra $157,300 in monthly revenue.
How Latency Reduces Conversions
Latency doesn’t just frustrate users – it directly impacts your bottom line. A 1-second delay in page load time can reduce conversion rates by 7–20%, with every additional 100ms delay costing about 1% in revenue. For a business pulling in $365 million annually, shaving off just 100ms could mean an extra $3.65 million in yearly revenue.
The effects of latency are especially damaging during checkout. For instance, a furniture e-commerce site reduced its mobile load time from 5.4 seconds to 2.1 seconds in 2025. This led to a 40% drop in bounce rate and a 92% boost in conversion rate. Their monthly revenue jumped from $2.1 million to $3.8 million – an 81% increase, or roughly $1.7 million more per month – all from a relatively small investment. Additionally, checkout completion rates plummet when delays increase: they drop from 35% when the process takes 0–2 seconds to just 12% when it takes 5 seconds or more.
But the damage doesn’t stop there. Latency also erodes customer loyalty. Around 79% of shoppers who experience performance issues are less likely to return to the same site. Speed is a critical factor in building trust with your audience. And mobile users? They’re about 24% less patient than desktop users when faced with the same delays.
What Causes High Mobile Latency
Mobile Latency Causes and Their Impact on Page Load Time
Common Latency Causes
High mobile latency is typically a combination of several factors working together to slow things down. One major issue is physical distance. For example, a request traveling from Sydney to San Francisco can add up to 1.5 seconds to the load time of a page. Even though data moves at nearly the speed of light, every kilometer introduces a small delay that quickly adds up.
Another culprit is network protocol overhead, which eats into your available speed before data even starts transferring. Tasks like DNS lookups, TCP handshakes, and TLS negotiations can take up about 300ms of the 1,000ms "speed budget" available on a typical 4G connection. Additionally, servers often don’t use the full bandwidth right away. Due to TCP slow start, servers initially send only around 14KB (10 packets) during the first roundtrip, meaning larger files require multiple roundtrips to load.
JavaScript execution tends to cause more issues than images on mobile devices. Patrick Meenan, a Software Engineer at Google, explains:
"Scripts are usually a (bigger) issue because of the time it takes to actually execute the script in addition to the download size… it can take several seconds to run a script even after it has been downloaded".
This problem becomes worse on mobile devices with weaker CPUs, where execution delays are more pronounced.
Third-party scripts add to the complexity. Tracking tags, pixels, and social widgets require the browser to establish new connections to external domains, which increases latency. Each of these scripts can add 0.2 to 0.5 seconds to your page’s load time. Similarly, render-blocking resources like external CSS and synchronous JavaScript prevent the browser from processing HTML, delaying the first render. On top of that, unoptimized images exacerbate the problem. The average mobile page in 2026 is expected to weigh over 2MB – three times heavier than pages in 2016.
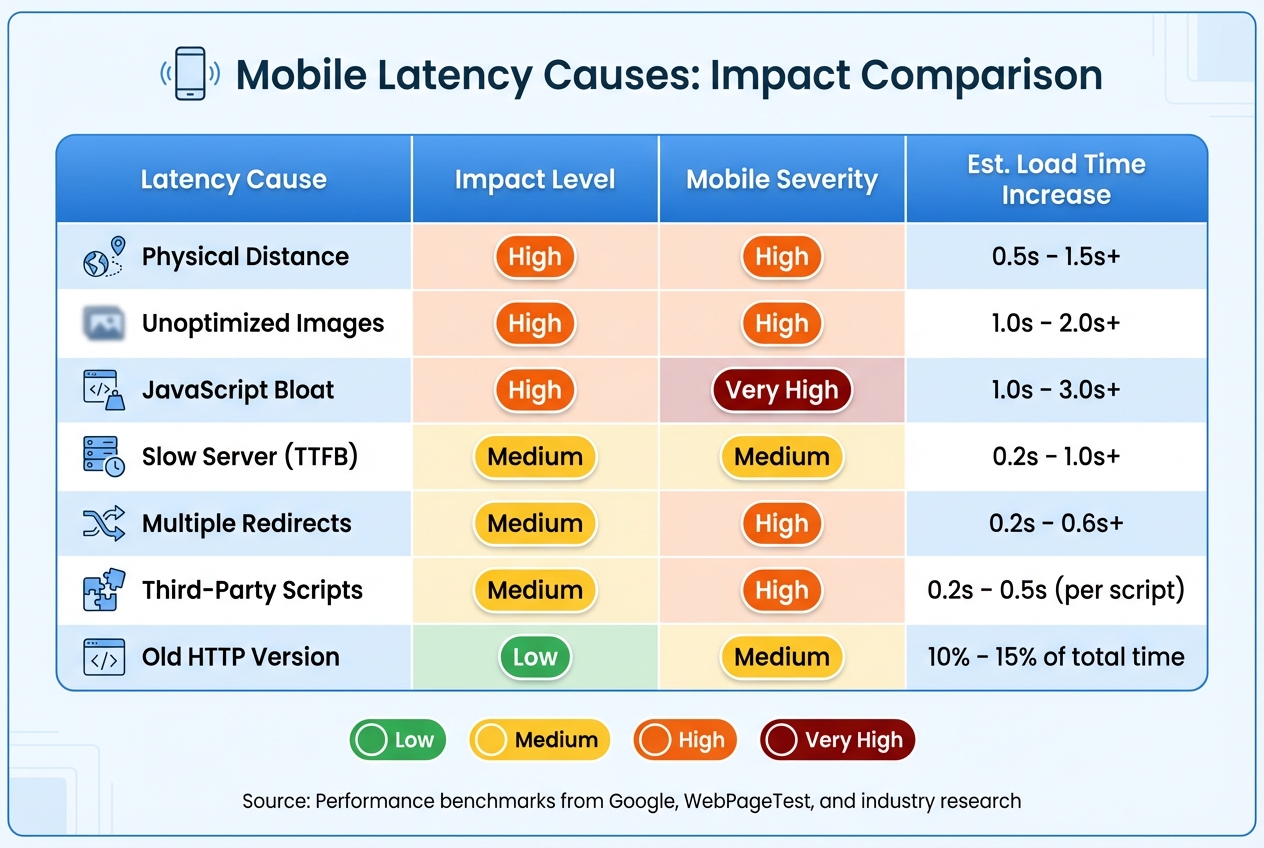
Latency Causes Comparison Table
The table below highlights the impact of various factors contributing to mobile latency.
| Latency Cause | Impact Level | Mobile Severity | Est. Load Time Increase |
|---|---|---|---|
| Physical Distance | High | High | 0.5s – 1.5s+ |
| Unoptimized Images | High | High | 1.0s – 2.0s+ |
| JavaScript Bloat | High | Very High | 1.0s – 3.0s+ |
| Slow Server (TTFB) | Medium | Medium | 0.2s – 1.0s+ |
| Multiple Redirects | Medium | High | 0.2s – 0.6s+ |
| Third-Party Scripts | Medium | High | 0.2s – 0.5s (per script) |
| Old HTTP Version | Low | Medium | 10% – 15% of total time |
Addressing these issues is key to improving mobile performance. In the next section, we’ll explore tools and strategies to measure and reduce mobile latency effectively.
How to Measure Mobile Latency
Latency Measurement Tools
To measure mobile latency effectively, you need tools that can identify where delays occur. Google Lighthouse is a great starting point. It audits your URL in a controlled setup and provides recommendations for performance, accessibility, and SEO. But here’s a tip: a single test run can be misleading. Running Lighthouse five times and using the median result gives you a more reliable picture.
PageSpeed Insights (PSI) combines Lighthouse lab data with real-world data from the Chrome User Experience Report (CrUX) for a broader performance view. Another must-have tool is WebPageTest, which allows you to test on real mobile devices under real network conditions worldwide. According to Rich Howard, CEO of Optimal, WebPageTest is essential for performance engineers.
When reviewing results, focus on Core Web Vitals. For instance:
- Largest Contentful Paint (LCP) should be 2.5 seconds or less for 75% of visits.
- Interaction to Next Paint (INP) measures responsiveness; anything over 500ms indicates poor performance.
- Time to First Byte (TTFB) is critical because it sets the stage for everything else. Aim for under 800ms; anything over 1.8 seconds signals issues.
Keep in mind that on 4G networks, just the network overhead (like DNS lookups, TCP handshakes, and TLS connections) can take about 300ms before any content starts loading. This makes evaluating these metrics under real-world conditions crucial.
Testing on Actual Mobile Networks
While lab tests are helpful for setting benchmarks, testing on real mobile networks uncovers issues that simulations miss. For example, lab tests can’t account for inconsistent signal strength or "lie-fi" – when devices show connectivity but fail to retrieve resources. This is where field data from Real User Monitoring (RUM) comes into play. RUM captures performance metrics from actual users across various devices, network conditions, and locations.
"Field data is what you should use to prioritize your efforts. Since field data represents what real users are experiencing, it’s the most accurate way to really understand what your users are struggling with".
Testing on real networks can reveal bottlenecks that lab tools overlook. With WebPageTest, you can choose specific server locations (like rural areas in the US or regions in India) and test on different connection types (2G, 3G, 4G) to see how latency varies. The web-vitals JavaScript library, paired with the Long Animation Frames API, helps pinpoint the exact DOM elements or scripts causing delays during interactions. For more hands-on debugging, try using a real mobile device with Chrome Developer Tools‘ Performance panel. It’s a useful way to profile runtime and identify bottlenecks.
On a typical 4G network, each request adds about 100ms. To keep your pages loading in under one second, aim for server responses under 200ms.
How to Reduce Mobile Network Latency
Once you’ve measured latency, the next logical step is to tackle it with specific optimizations.
Use a Content Delivery Network (CDN)
A CDN helps reduce latency by caching your website’s content on edge servers closer to your users. For example, if someone in Dallas visits your site, the data is served from a nearby server rather than a distant one, cutting down the travel time for data. Many modern CDNs also use HTTP/3, which minimizes handshake delays, further reducing latency. Plans like BlazingCDN start at just $4 per terabyte, making them an affordable way to speed up your mobile site.
Optimize Images and Minify Code
Images typically account for 50–70% of a mobile page’s weight. Switching to modern image formats like WebP or AVIF can cut file sizes by 25–50% while maintaining visual quality. For instance, converting a 1 MB JPEG image to AVIF at 80% quality can shrink it to approximately 46 KB, reducing its size by up to 95%. Tools like Squoosh simplify the process of converting and compressing images before uploading. For critical visuals, such as hero images, using the fetchpriority="high" attribute ensures they load quickly. Discord enhanced its Largest Contentful Paint (LCP) by preloading these images and applying this attribute.
On top of image optimization, minifying JavaScript and CSS and enabling Brotli compression can make a significant difference. Brotli is 20% more efficient than Gzip, helping reduce file sizes further. For example, trimming 400 KB from a JavaScript bundle on a 10 Mbps mobile connection can save roughly 320 milliseconds in load time. When it comes to mobile performance, every millisecond matters.
Test Optimized Content with PageTest.AI
After optimizing your assets, it’s important to see how those changes impact user engagement. Tools like PageTest.AI allow you to test variations of headlines, calls-to-action, button text, and more – all without any coding. This platform tracks key performance metrics like clicks, time on page, engagement, and scroll depth. It works seamlessly with website builders such as WordPress, Wix, and Shopify, and even offers AI-generated content variations to streamline testing. Pricing starts at $10 per month for 10,000 test impressions, making it an accessible tool for small businesses looking to refine their site’s performance.
Conclusion
High latency can drag down your mobile site’s performance, distracting users and causing them to leave. On mobile networks, latency can easily add 300ms or more just for basic network overhead, making every millisecond matter when you’re trying to hit that critical 2-second load time goal.
Key Takeaways
Lowering latency doesn’t just make your site faster – it improves the user experience and boosts conversions. The numbers are clear: a 1-second delay in mobile load time can slash conversions by 20%, and 53% of users will abandon a site that takes more than 3 seconds to load. Even reducing load time from 4.2 seconds to 2.1 seconds can lead to a 92% increase in conversions.
There are practical ways to achieve this. Using a CDN, optimizing images with modern formats, and other tweaks can help you hit the 2-second load time target. Every small improvement gets you closer to better performance.
Next Steps
Ready to act? Start by measuring your current mobile latency with tools designed to test on actual mobile networks. Pinpoint the causes of delays – whether it’s server response time, oversized images, or excessive network requests – and tackle the biggest issues first. Aim for a Time to First Byte (TTFB) under 200ms and keep above-the-fold content under 98KB.
Once you’ve optimized, measure the impact. See how your changes influence user behavior. Tools like PageTest.AI let you experiment with different headlines, CTAs, and button designs to find what works best on your faster site. With plans starting at $10 per month for 10,000 test impressions, it’s a cost-effective way to ensure your speed improvements lead to tangible business results.
FAQs
What’s the difference between latency and bandwidth on mobile?
Latency and bandwidth play a major role in determining mobile page speed. Latency is all about how long it takes for data to travel between its source and destination, directly affecting how quickly a page responds to user actions. Bandwidth, on the other hand, is the maximum amount of data that can be transferred within a specific timeframe, which impacts how fast content loads.
High latency can lead to frustrating delays in interactions, while low bandwidth makes data transfer sluggish. Together, these two factors are critical for ensuring smooth and efficient mobile performance.
Which metric should I fix first: TTFB, LCP, or INP?
Improving Time to First Byte (TTFB) is a key starting point for boosting your website’s performance. Why? Because TTFB acts as the foundation for other critical metrics like First Contentful Paint (FCP) and Largest Contentful Paint (LCP). If TTFB is slow, it creates a ripple effect, delaying these metrics and dragging down your overall page speed. By focusing on reducing TTFB, you establish a solid baseline that makes it easier to optimize the rest of your site’s performance.
How do I tell if slow load times are caused by third-party scripts?
To spot slow third-party scripts, tools like Lighthouse and Chrome DevTools can be incredibly useful. Lighthouse flags code that blocks the main thread for over 250ms, giving you a clear view of what might be slowing things down. Meanwhile, Chrome DevTools lets you dive deeper, analyzing network requests to see how external scripts impact performance.
Pay close attention to any external scripts that seem to delay your page’s loading speed. By reviewing resource loading patterns, you can pinpoint the exact causes of sluggish performance. These tools provide the insights you need to tackle third-party script issues and boost your page speed effectively.
Related Blog Posts
say hello to easy Content Testing
try PageTest.AI tool for free
Start making the most of your websites traffic and optimize your content and CTAs.
Related Posts

![]() 30-03-2026
30-03-2026
 Ian Naylor
How Internal Links Boost Conversions
Strategic internal links guide users, improve SEO, and turn site navigation into measurable conversion growth.

![]() 28-03-2026
28-03-2026
Ian Naylor
Core Web Vitals Benchmarks by Industry
Industry Core Web Vitals benchmarks and practical fixes for LCP, INP, and CLS, plus mobile vs desktop gaps and optimization tips.

![]() 26-03-2026
26-03-2026
Ian Naylor
How to Benchmark Mobile Retention Rates
Benchmark Day 1/7/30 retention, run cohort analysis, and optimize onboarding, habit triggers, and personalization to improve app retention.