

Core Web Vitals vs. Page Speed: Key Differences
Core Web Vitals vs. Page Speed: Key Differences
![]() 01-01-2026 (Last modified: 09-01-2026)
01-01-2026 (Last modified: 09-01-2026)
Core Web Vitals and Page Speed are often confused but serve distinct purposes in website performance. Here’s our super quick breakdown:
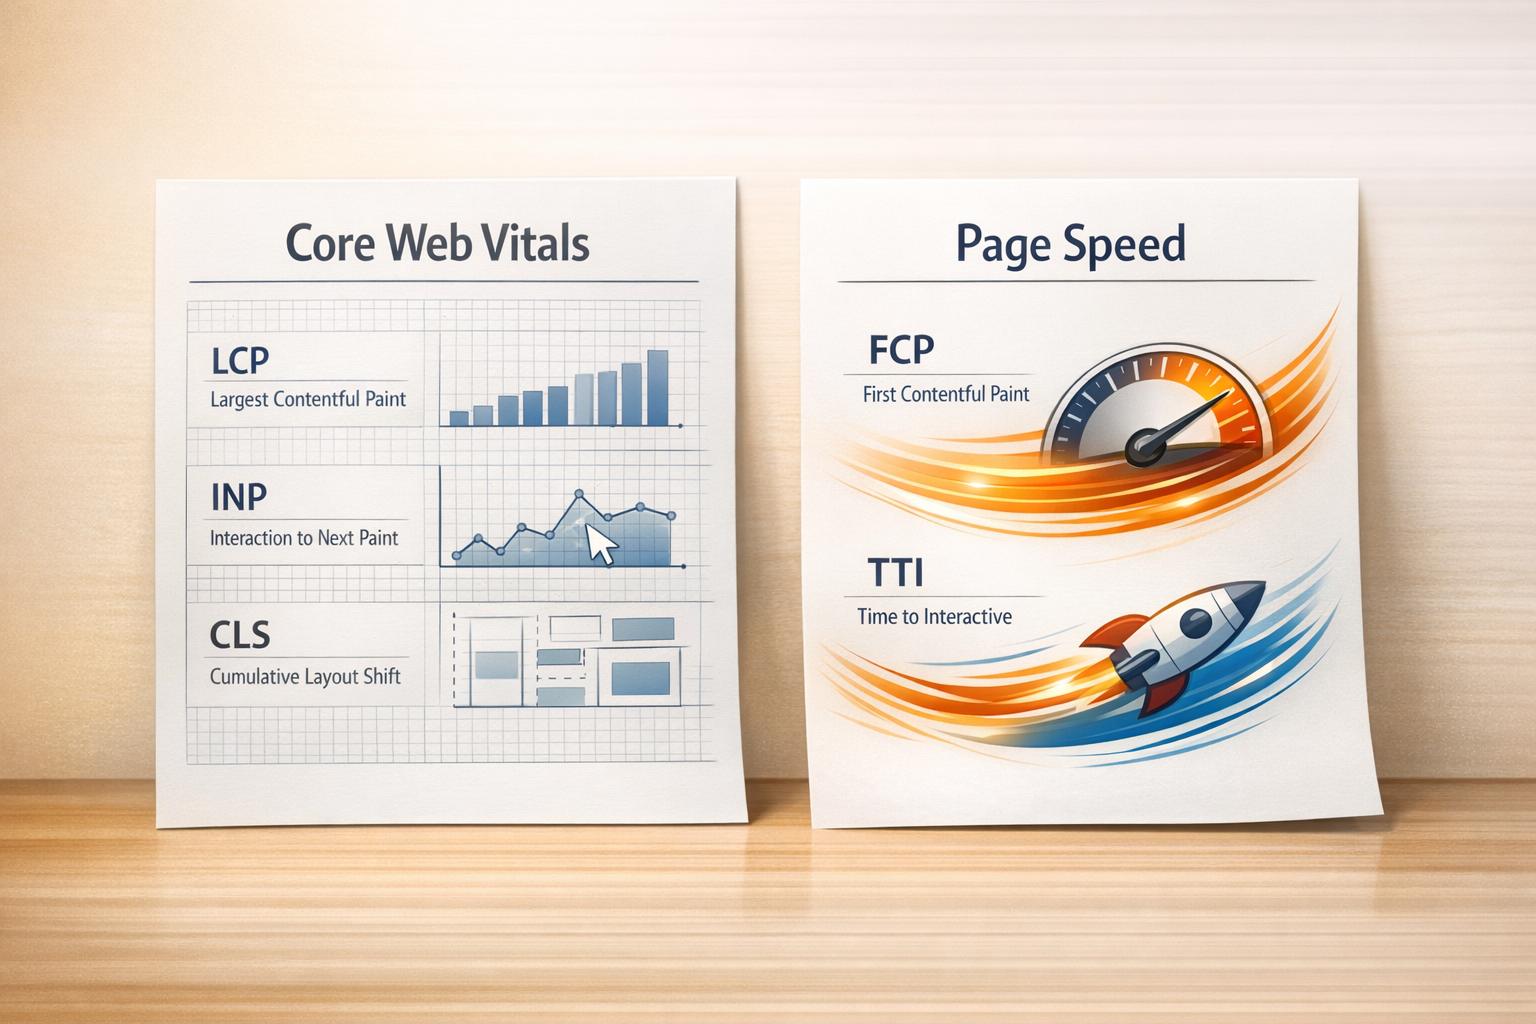
- Core Web Vitals focus on user experience with three key metrics:
- Largest Contentful Paint (LCP): Measures loading speed (should be ≤ 2.5 seconds).
- Interaction to Next Paint (INP): Tracks responsiveness (should be ≤ 200 milliseconds).
- Cumulative Layout Shift (CLS): Ensures visual stability (should be ≤ 0.1).
- Page Speed evaluates overall loading performance using broader metrics like:
- First Contentful Paint (FCP): Time until the first visual element appears.
- Time to Interactive (TTI): Time until the page is fully usable.
- Speed Index: How quickly content becomes visible.
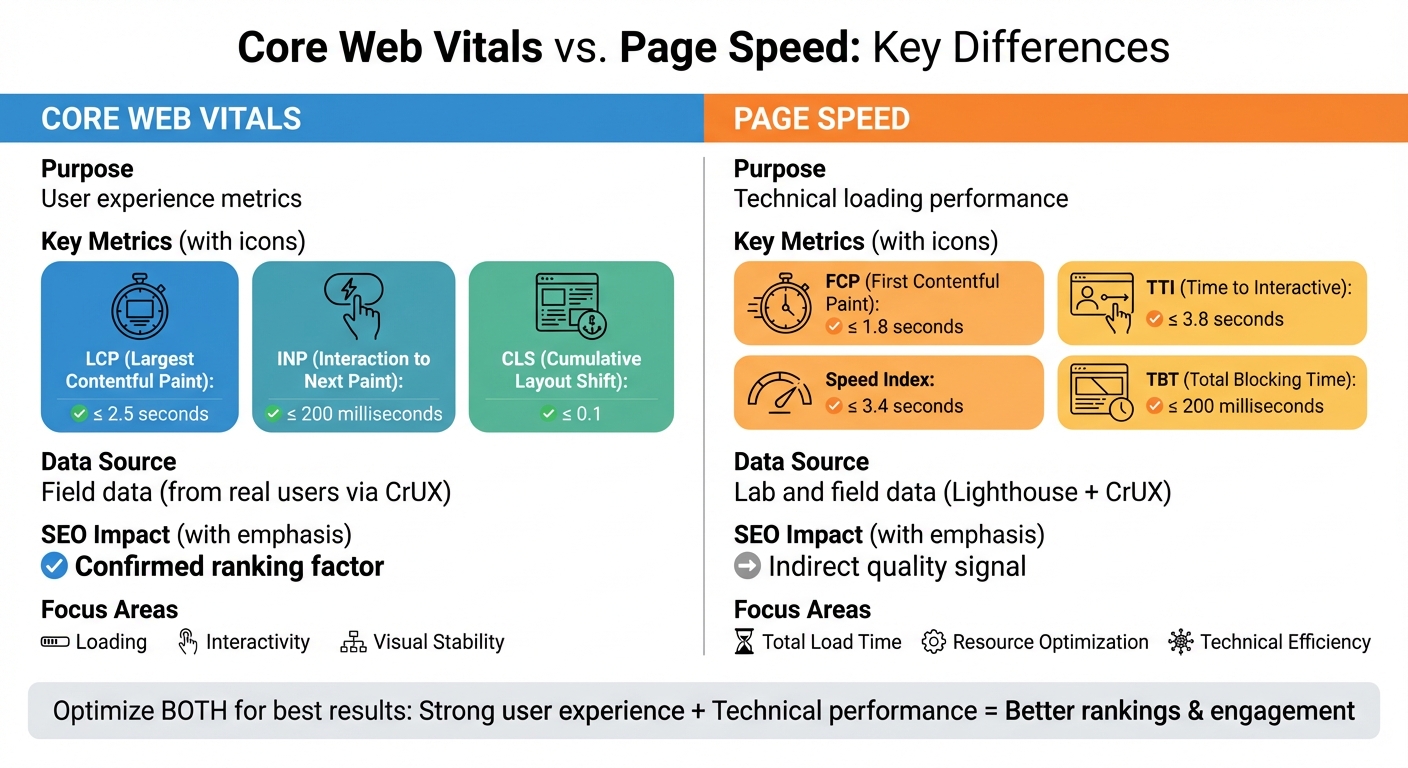
Key Difference: Core Web Vitals prioritize user experience and are direct ranking factors for Google. Page Speed focuses on technical performance but indirectly impacts rankings.
Quick Comparison:
| Feature | Core Web Vitals | Page Speed |
|---|---|---|
| Purpose | User experience metrics | Technical loading performance |
| Key Metrics | LCP, INP, CLS | FCP, TTI, Speed Index, TBT |
| Data Source | Field data (from real users) | Lab and field data |
| SEO Impact | Confirmed ranking factor | Indirect quality signal |
To optimize your site, aim for strong Core Web Vitals scores while addressing broader Page Speed issues like server response time, resource optimization, and code efficiency.
“We’ve seen teams obsess over shaving milliseconds off load time while ignoring layout shift and interaction delays. In practice, Core Web Vitals issues cause far more real user frustration than raw page speed ever did.” Ian Naylor, Founder of PageTest.ai
Core Web Vitals vs Page Speed: Key Metrics and Differences Comparison
Google Core Web Vitals: A Complete Guide For Beginners
What Are Core Web Vitals?
Core Web Vitals are a set of metrics that gauge how real users experience your website. They focus on three key aspects of user experience: loading performance, interactivity, and visual stability. These metrics not only influence user satisfaction but also directly affect your search rankings.
“Site owners shouldn’t have to be performance experts to understand the quality of experience they are delivering to their users. The Web Vitals initiative aims to simplify the landscape.” – Philip Walton, Engineer, Google
Rather than relying on lab tests, Core Web Vitals are based on anonymized data from real Chrome users. Google assesses these metrics at the 75th percentile of page loads, ensuring that meeting “Good” thresholds for LCP, FID/INP, and CLS delivers a solid experience for most visitors. Let’s break down what each of these metrics means for your site’s performance.
Largest Contentful Paint (LCP)
LCP measures how quickly the largest visible content element – like a hero image, video poster, or a prominent text block – appears on the screen. This metric directly impacts a user’s first impression of your site. To provide a smooth experience, your LCP should be 2.5 seconds or less.
In 2021, Vodafone improved their LCP by 31%, which led to an 8% increase in sales, a 15% boost in their lead-to-visit rate, and an 11% rise in their cart-to-visit rate.
First Input Delay (FID)
FID tracks how quickly your site reacts to a user’s first interaction, such as clicking a link, tapping a button, or pressing a key. A good FID score is 100 milliseconds or less. However, in March 2024, Google replaced FID with Interaction to Next Paint (INP), which measures responsiveness throughout the entire visit. The recommended INP score is 200 milliseconds or less.
Cumulative Layout Shift (CLS)
CLS measures how stable your page elements are during loading. Ever clicked on something by accident because content shifted unexpectedly? That’s what CLS evaluates. A good CLS score is 0.1 or less. The score is calculated by multiplying the “impact fraction” (the portion of the screen affected) by the “distance fraction” (how far elements move). In our experience, pages that load fast but feel unstable or unresponsive still struggle with engagement. Users don’t care how quick a page loads if it jumps around or ignores their first click.
Swappie optimized their mobile site in 2024, achieving a 91% improvement in CLS. This contributed to a 42% increase in mobile revenue.
| Metric | What It Measures | Good Score | Poor Score |
|---|---|---|---|
| LCP | Loading Speed | ≤ 2.5 seconds | > 4.0 seconds |
| FID | First Interaction | ≤ 100 milliseconds | > 300 milliseconds |
| INP | Overall Responsiveness | ≤ 200 milliseconds | > 500 milliseconds |
| CLS | Visual Stability | ≤ 0.1 | > 0.25 |
What Is Page Speed?
Page speed refers to how quickly a webpage loads and becomes visible to visitors. Unlike Core Web Vitals, which focus on specific user experience milestones, page speed takes into account a broader range of technical factors.
Google’s own data shows that as page load time goes from 1s to 3s, the probability of bounce increases by 32%, but Core Web Vitals focus on what happens after load, not just how fast it happens.
Several components influence page speed, including server response time, the number of requests a page makes, code complexity, and the total size of the page. Together, these factors determine how fast a page loads. Research shows that pages taking longer than 3 seconds to load lose over 25% of their visitors.
“Users care about page performance because the longer a page takes to load, the lower the satisfaction rate with that page.” – James Gibbons, Senior Customer Success Manager, Quattr
Page speed can be evaluated using two types of data: simulated lab data and real-world field data, or a combination of both.
Key Page Speed Metrics
Beyond Core Web Vitals, there are various diagnostic metrics that help identify performance issues. First Contentful Paint (FCP) measures the time it takes for the first text or image to appear on the screen – aim for 1.8 seconds or less. Speed Index evaluates how quickly content visually appears during the loading process, with a target of 3.4 seconds or less.
Time to Interactive (TTI) gauges when a page becomes fully interactive and responsive to user input, ideally within 3.8 seconds. Total Blocking Time (TBT) measures the delay between FCP and TTI when the main thread is unable to respond to user actions – this should be under 200 milliseconds. These metrics are particularly useful for diagnosing issues that could affect Core Web Vitals performance.
| Metric | What It Measures | Good Threshold |
|---|---|---|
| First Contentful Paint (FCP) | Time until the first text or image appears | ≤ 1.8 seconds |
| Speed Index (SI) | How quickly content becomes visually available | ≤ 3.4 seconds |
| Time to Interactive (TTI) | Time until the page is fully interactive | ≤ 3.8 seconds |
| Total Blocking Time (TBT) | Main thread blocking time between FCP and TTI | ≤ 200 milliseconds |
These metrics collectively provide a clearer picture of how your page performs and where improvements might be needed.
Page Speed Scores
Google PageSpeed Insights assigns a score between 0 and 100 to your site. A score of 90 or above is considered “Good” (green), scores from 50 to 89 indicate “Needs Improvement” (amber/orange), and anything below 50 is labeled “Poor” (red). These scores are based on the 75th percentile of page loads, ensuring they reflect the experience of most users, including those with slower devices or networks.
“PSI isn’t a ranking factor; it’s just a ‘lab’ tool to help you to find issues to work on.” – John Mueller, Senior Search Analyst, Google
It’s worth noting that page speed scores can vary over time, even if no changes are made to your site. Factors like simulated testing conditions – such as using a Moto G4 device on a mobile network to mimic older hardware and slower connections – can influence the results. While these scores don’t directly impact search rankings, they offer insights into technical issues that might affect Core Web Vitals and overall user experience.
Core Web Vitals vs. Page Speed: Main Differences
Though often used interchangeably, Core Web Vitals and Page Speed serve distinct purposes in website optimization. Core Web Vitals focus on user experience, measuring how visitors perceive your site’s performance in terms of loading, interactivity, and visual stability. On the other hand, Page Speed is a broader concept that evaluates the technical performance of your site – how quickly browsers load and display content.
The key difference lies in their measurement. Core Web Vitals rely on three specific metrics to gauge user experience: Largest Contentful Paint (LCP), Interaction to Next Paint (INP), and Cumulative Layout Shift (CLS). Page Speed, however, uses diagnostic metrics like First Contentful Paint (FCP), Time to Interactive (TTI), Total Blocking Time (TBT), and Speed Index to assess technical efficiency. In essence, Core Web Vitals focus on the user’s perspective, while Page Speed examines the technical side. This distinction shapes strategies for improving user experience versus optimizing technical performance.
“Core Web Vitals are specifically designed to measure how users experience your website – they are user-centric metrics.” – Barry Pollard, Addy Osmani, et al., web.dev
Another major distinction is their role in search rankings. Google has confirmed that Core Web Vitals are a direct ranking signal within its “Page Experience” algorithm. While Page Speed still matters for overall site quality, it functions more as an indirect signal, contributing to general performance rather than directly influencing rankings.
“We’ve seen better ranking stability by fixing CLS and INP issues than by chasing perfect speed scores. Core Web Vitals align far more closely with how real users judge a page.” Becky Halls, Strategist at PageTest.ai
Comparison Table
| Feature | Core Web Vitals | Page Speed (General) |
|---|---|---|
| Primary Purpose | Measure user-centric experience (UX) | Evaluate technical loading speed |
| Specific Metrics | LCP, INP, CLS | FCP, TTI, TBT, Speed Index, TTFB |
| Data Source | Field Data (CrUX) | Lab Data (Lighthouse) & Field Data |
| SEO Status | Confirmed Ranking Factor | General Quality Signal |
| Focus Area | Loading, Interactivity, Stability | Total Load Time, Resource Use |
These differences highlight why understanding both Core Web Vitals and Page Speed is essential for achieving well-rounded site performance.
Real User Data vs. Lab Testing
Core Web Vitals rely on real-world user data, while Page Speed often depends on lab-based testing. Core Web Vitals use CrUX (Chrome User Experience Report) field data, which reflects real user experiences across various devices and networks, updated daily.
In contrast, Page Speed assessments typically utilize tools like Lighthouse, which simulate website performance in controlled environments. These lab tests use fixed parameters to replicate page loads. While lab testing is great for identifying issues and debugging, it doesn’t always capture the variability of real-world conditions. Field data accounts for actual user interactions, including cached assets and diverse network speeds.
“Lab-based tools such as Lighthouse are diagnostic tools to highlight potential performance problems and best practices.” – Barry Pollard, Addy Osmani, et al., web.dev
This difference means that a site can achieve high Page Speed scores in lab tests but still fall short on Core Web Vitals in real-world scenarios. Lab tools simulate a “cold load” for a first-time visitor, while field data reflects the experiences of returning users and those with cached content.
sbb-itb-6e49fcd
How Each Metric Affects User Experience
Core Web Vitals and User Satisfaction
Core Web Vitals zero in on three key aspects of the web experience that matter most to users: loading, interactivity, and visual stability. These metrics highlight the moments that shape how users feel about your site.
- Largest Contentful Paint (LCP) measures the time it takes for your page’s main content to appear – essentially when users see something useful. A good LCP score is 2.5 seconds or less, ensuring users quickly access the content they’re looking for, even if background elements are still loading.
- Interaction to Next Paint (INP) tracks how fast your site responds to user actions like clicks, taps, or keystrokes throughout their visit. A good INP score is 200 milliseconds or less, making interactions feel smooth and responsive. This metric is more demanding than the older First Input Delay (FID), with only 64% of websites passing INP compared to 93% for FID.
- Cumulative Layout Shift (CLS) focuses on preventing sudden shifts in page layout that can frustrate users or lead to accidental clicks. A good CLS score of 0.1 or less ensures that elements stay stable as the page loads. For example, Swappie, a retailer specializing in refurbished phones, improved its CLS by 91% in 2024 and saw mobile revenue jump by 42% – a clear link between visual stability and conversions.
These metrics tie measurable performance directly to how users perceive and interact with your site.
Page Speed and Overall Perception
Beyond Core Web Vitals, traditional Page Speed metrics offer a broader technical perspective on performance. They focus on milestones like total load time, shaping how users view your site’s overall speed. While Core Web Vitals capture specific user interactions, Page Speed metrics assess how quickly browsers load and display content.
Why does this distinction matter? Two sites with the same 1.5-second load time can feel completely different. A site that progressively displays content feels faster than one that stays blank until fully loaded. Metrics like Time to Interactive (TTI) and Speed Index help identify these differences and pinpoint bottlenecks.
Speed impacts engagement directly – slower sites can see engagement drop by 15%. Even tiny delays, measured in microseconds, can change how users perceive your site, shifting it from “fast” to “slow”. By optimizing both Page Speed and Core Web Vitals, you ensure not only technical efficiency but also a seamless, satisfying experience for users. Together, these metrics create a complete picture of performance that resonates with visitors.
Tools for Measuring Core Web Vitals and Page Speed
If you’re looking to evaluate your site’s performance, Google’s free tools are a great place to start. They provide everything from high-level insights to detailed technical analysis, helping you identify both user experience and technical issues. These tools work hand-in-hand with optimization strategies by highlighting areas that need attention.
Google PageSpeed Insights
PageSpeed Insights (PSI) combines real-world user data from the Chrome User Experience Report (CrUX) with simulated lab tests powered by Lighthouse. The lab tests mimic page loads on a mid-range device, like a Moto G4, under preset network conditions.
If a URL doesn’t have enough traffic to generate CrUX data, PSI switches to “origin” data, which reflects your site’s overall performance. This tool updates daily, making it easy to track the impact of recent changes on your scores.
Lighthouse
Lighthouse is a diagnostic tool built into Chrome DevTools, designed to measure site performance in a controlled setting. It assigns a performance score between 0 and 100, with anything 90 or above deemed “Good”, 50 to 89 indicating room for improvement, and below 50 considered poor. The tool’s “Audits” and “Opportunities” sections provide actionable recommendations for improvement.
While Lighthouse excels at diagnosing issues, it doesn’t measure Interaction to Next Paint (INP) directly, as that requires real user interaction. Instead, it uses Total Blocking Time (TBT) as a lab-based stand-in. This makes it a valuable tool for refining performance before testing with actual users.
Google Search Console Core Web Vitals Report
For a broader, real-world view of your site’s performance, Google Search Console (GSC) is indispensable. Unlike PSI, which evaluates individual URLs, GSC groups similar pages – like all product or blog pages – making it easier to spot widespread issues. It categorizes pages as “Good”, “Need Improvement”, or “Poor” based on the same 28-day rolling average used by PSI.
This grouping feature is especially helpful for identifying template-level problems affecting multiple pages. GSC’s insights are based on real-world data, offering a comprehensive look at your site’s overall health.
| Tool | Data Type | Use Case |
|---|---|---|
| PageSpeed Insights | Lab & Field | Quick page-level audits and overviews (publicly available) |
| Lighthouse | Lab | Pinpointing technical fixes (via Chrome DevTools, extension, CLI) |
| Search Console | Field | Monitoring site-wide performance and grouping (requires verification) |
Why You Should Optimize Both Metrics
Core Web Vitals and page speed go hand in hand: one evaluates user experience, while the other measures how quickly a page fully loads. Ignoring either can lead to frustrated users and lower search rankings. Addressing both is key to balancing technical performance with user satisfaction.
SEO Benefits of Both Metrics
Google factors page experience into its ranking algorithm, especially when content relevance is closely matched between competing pages. As Danny Sullivan, Google’s Search Liaison, puts it:
“It talks about these things aligning with what we do measure ‘page experience aspects, aligns with what our core ranking systems seek to reward.'”
Here’s why this matters: If your page takes too long to load – say, 5 seconds instead of 1 – bounce rates can skyrocket by 90%. For Core Web Vitals, Google requires your site to meet “Good” thresholds at the 75th percentile of visits to pass their evaluation. Falling short on any of these benchmarks could mean missing out on valuable rankings.
Optimization Strategies That Work
To make the most of these SEO advantages, focus on these effective strategies:
- Minify your code: Use tools like HTMLMinifier, CSSNano, or UglifyJS to streamline your HTML, CSS, and JavaScript by removing unnecessary characters.
- Optimize media: Compress images and videos, replace GIFs with video formats, and specify height and width attributes to prevent layout shifts. For content below the fold, enable lazy loading with the
loading="lazy"attribute, while ensuring above-the-fold content loads immediately. - Leverage a CDN: Content Delivery Networks (CDNs) help deliver static files faster by using servers closer to your users.
- Improve server response times: Use caching plugins like WP Rocket or W3 Total Cache to lower Time to First Byte (TTFB). If your server response is consistently slow, consider upgrading your hosting.
- Streamline JavaScript: Break up lengthy JavaScript tasks and remove unused code to keep your pages responsive and improve Interaction to Next Paint scores.
Conclusion
Core Web Vitals and page speed each address different aspects of website performance, and improving both is essential for success. While page speed focuses on how quickly a page’s resources load, Core Web Vitals zero in on three critical components of user experience: loading (measured by Largest Contentful Paint or LCP), interactivity (captured by Interaction to Next Paint or INP), and visual stability (tracked by Cumulative Layout Shift or CLS).
Google has confirmed that Core Web Vitals serve as a ranking signal. Pages that meet the “Good” thresholds – LCP under 2.5 seconds, INP under 200 milliseconds, and CLS below 0.1 – can gain an edge in search rankings when content relevance is comparable. However, as John Mueller, Google’s Search Advocate, reminds us:
“…relevance is still by far much more important. So just because your website is faster with regards to Core Web Vitals than some competitors doesn’t necessarily mean that …you will jump to position number one in the search results.”
To achieve both SEO success and user satisfaction, it’s essential to strike a balance between these metrics. Use tools like Lighthouse to identify technical barriers and validate your efforts with real-world data from Google Search Console. This combined strategy ensures your site delivers strong technical performance while providing a smooth, enjoyable experience for users.
FAQs
Why does Google use Core Web Vitals as ranking factors?
Google relies on Core Web Vitals as direct ranking factors because they zero in on essential aspects of user experience. These metrics evaluate three key areas: loading performance, interactivity, and visual stability. The goal? To make sure websites deliver a fast, seamless, and enjoyable experience for visitors.
Since Core Web Vitals capture how users genuinely engage with a site, they heavily influence search rankings. Pages that perform well in these areas are more likely to rank higher, aligning with Google’s commitment to promoting sites that offer a positive browsing experience.
What is the difference between Core Web Vitals and traditional page speed metrics?
Core Web Vitals zero in on the real-world user experience by evaluating critical factors like Largest Contentful Paint (LCP), which measures loading performance, Interaction to Next Paint (INP), which gauges interactivity, and Cumulative Layout Shift (CLS), which tracks visual stability. These metrics rely on actual user data, offering insights into how visitors truly experience a website.
On the other hand, traditional page speed metrics – like First Contentful Paint (FCP) or Time to First Byte (TTFB) – are more technical and usually come from lab-based simulations. While both types of metrics play a role in website optimization, Core Web Vitals take a user-first approach, enabling businesses to better understand and refine their site’s overall experience.
What are the best tools to measure and improve Core Web Vitals on my site?
To get a handle on Core Web Vitals and improve your site’s performance, you can rely on a few essential tools that diagnose issues and provide optimization insights:
- Google Search Console: This tool gives you real-world data for each URL, breaking them down into categories like Good, Needs Improvement, or Poor. It focuses on metrics such as LCP, CLS, and INP, making it easier to spot pages that need attention.
- PageSpeed Insights: By combining real-user data with lab-based audits, this tool offers practical recommendations, like compressing images or cutting down server response times, to boost performance.
- Chrome DevTools: Want to see what’s slowing things down in real time? Chrome DevTools lets you analyze performance on the spot, identify sluggish resources, and compare local test results with user data.
Using these tools together gives you a well-rounded strategy for monitoring and fine-tuning Core Web Vitals, ensuring your site runs faster and offers a better experience for visitors.
Related Blog Posts
say hello to easy Content Testing
try PageTest.AI tool for free
Start making the most of your websites traffic and optimize your content and CTAs.
Related Posts

![]() 30-03-2026
30-03-2026
 Ian Naylor
How Internal Links Boost Conversions
Strategic internal links guide users, improve SEO, and turn site navigation into measurable conversion growth.

![]() 28-03-2026
28-03-2026
Ian Naylor
Core Web Vitals Benchmarks by Industry
Industry Core Web Vitals benchmarks and practical fixes for LCP, INP, and CLS, plus mobile vs desktop gaps and optimization tips.

![]() 26-03-2026
26-03-2026
Ian Naylor
How to Benchmark Mobile Retention Rates
Benchmark Day 1/7/30 retention, run cohort analysis, and optimize onboarding, habit triggers, and personalization to improve app retention.