

Real-Time Metrics for Different User Roles

Real-Time Metrics for Different User Roles
![]() 28-02-2026 (Last modified: 24-04-2026)
28-02-2026 (Last modified: 24-04-2026)
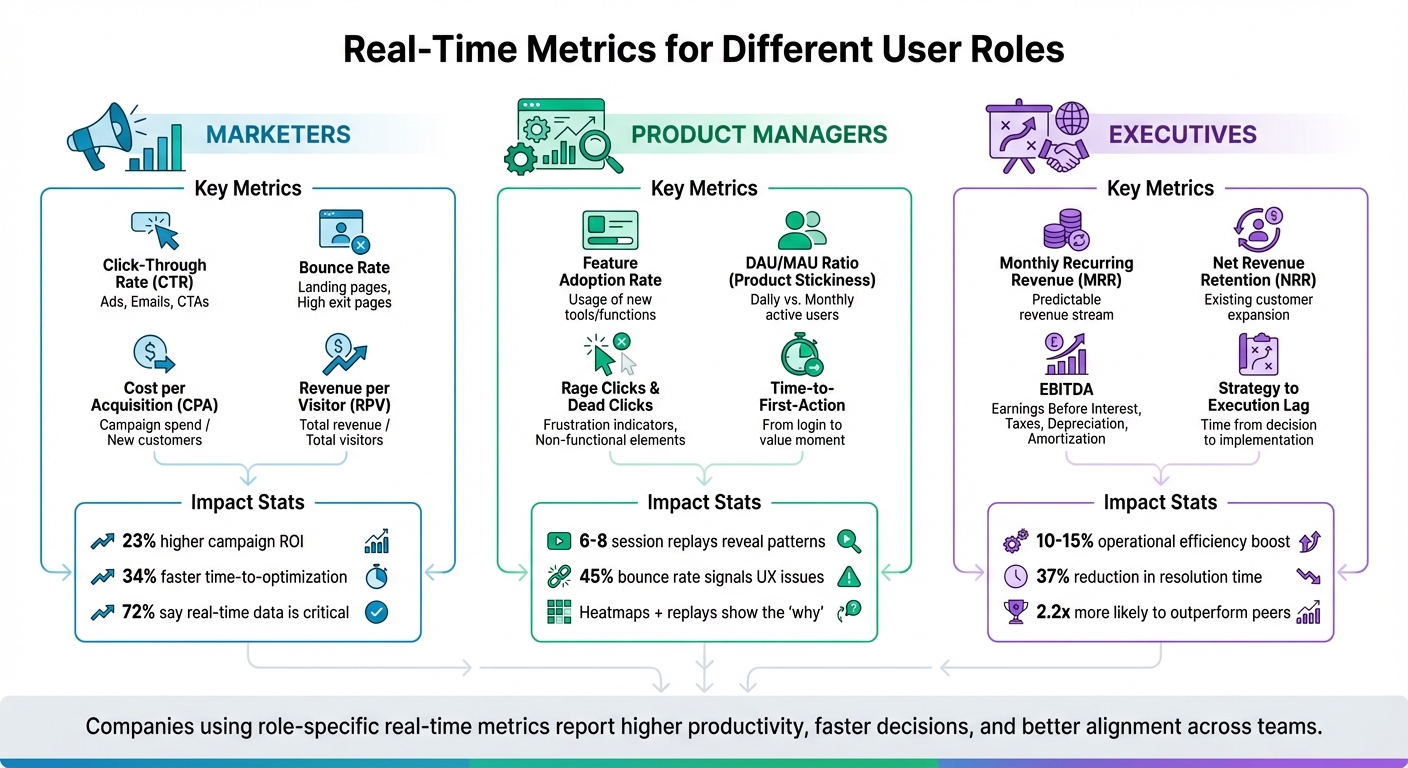
Real-time metrics help teams make faster, more informed decisions by providing actionable data specific to their roles. Instead of sifting through irrelevant information, role-specific dashboards focus on what matters most – improving efficiency and driving results. Here’s how real-time metrics empower different roles:
- Marketers track engagement, traffic, and conversion metrics like CTR, Bounce Rate, and CPA to optimize campaigns. Companies using real-time data report a 23% higher ROI and a 34% faster time-to-optimization.
- Product Managers monitor user behavior through metrics like Feature Adoption Rate, DAU/MAU ratios, and heatmaps to refine user experiences. Tools like session replays help identify and fix issues quickly.
- Executives rely on concise metrics like MRR, NRR, and EBITDA to make strategic decisions. Real-time dashboards reduce decision delays and improve operational efficiency by 10-15%.
Tailored real-time data not only boosts productivity but also aligns individual roles with broader company goals, fostering better collaboration and measurable improvements across teams.
Real-Time Metrics by User Role: Marketers, Product Managers, and Executives
Metrics for Marketers: Tracking Engagement and Traffic
Core Metrics for Marketing Teams
Marketing teams rely on a mix of traffic, engagement, and conversion metrics to understand performance in real time. For traffic, they monitor impressions, unique visitors, and source/medium breakdowns to pinpoint which channels are delivering results. Engagement metrics like Click-Through Rate (CTR), Bounce Rate, and Average Session Duration reveal how users are interacting with content. For example, CTR shows whether ads are connecting with audiences, while Bounce Rate highlights how often visitors leave without engaging, and Average Session Duration measures how long they stay.
Conversion metrics, such as Conversion Rate, Cost per Acquisition (CPA), and Funnel Drop-off Rates, track how effectively users move toward completing desired actions. In e-commerce, metrics like Revenue per Visitor (RPV) and Return on Ad Spend (ROAS) help teams fine-tune budgets to maximize profitability. Additionally, real-time social signals – like likes and shares – and tools like Net Promoter Score (NPS) and Customer Satisfaction (CSAT) provide valuable context to the numbers.
Consider these stats: 72% of marketers say real-time data is critical for optimizing campaigns, yet only 31% have the tools to act on it effectively. Companies that leverage real-time analytics report a 23% higher campaign ROI and a 34% faster time-to-optimization, compared to those relying on batch reporting.
Case Study: Marketing Metrics in Practice
A UK-based hair and beauty chain transformed its reporting process by integrating data from Google Analytics 4, Meta Ads, and email campaigns into a unified Looker Studio dashboard. This shift cut manual reporting time from five hours to just 30 minutes per week. The result? A 26% increase in new customer acquisitions and a staggering 390% jump in email revenue within just 30 days.
In another example, Hubstaff, a workforce management software company, revamped its landing page in March 2025 under the guidance of Senior VP of Marketing Alex Schutte. By closely monitoring real-time conversion metrics, they boosted their conversion rate by 59%, increasing it from 6.89% to 10.95% with a 98% confidence level.
Comparison Table: Standard vs. Marketing-Focused Metrics
| Metric Category | Standard Metric | Marketing-Focused Metric | Benefit of Marketing Focus |
|---|---|---|---|
| Traffic | Total Page Views | Unique Visitors by Source | Identifies which channels bring in high-quality leads |
| Engagement | Session Count | Click-Through Rate (CTR) | Measures how well ad creative resonates with users |
| Success | Total Sales | Revenue per Visitor (RPV) | Combines conversion rate and order value for efficiency |
| Efficiency | Total Spend | Cost per Acquisition (CPA) | Ensures spending delivers profitable customer acquisition |
Metrics for Product Managers: Improving User Experience
Core Metrics for Product Teams
For product managers, understanding where users encounter challenges is crucial. Metrics like rage clicks and dead clicks can reveal user frustration caused by technical glitches, slow load times, or unintuitive design choices. These signals help identify areas that need immediate attention.
Other metrics, such as a bounce rate exceeding 45% or shallow scroll depth, often point to UX problems like intrusive pop-ups or sluggish page speeds. Similarly, low onboarding completion rates or extended time-to-first-action highlight confusion with the interface or unclear navigation paths. By focusing on these specific measurements, product teams can make real-time adjustments that improve the user experience while staying aligned with broader strategic objectives.
The Feature Adoption Rate is another key metric, shedding light on whether a feature is poorly designed, difficult to locate, or simply not meeting user needs. Meanwhile, product stickiness, calculated as the ratio of Daily Active Users (DAU) to Monthly Active Users (MAU), offers a snapshot of user retention and engagement.
"Basically, all KPIs are metrics, but not all metrics are KPIs." – Contentsquare’s Content Team
To further refine the user experience, tracking events like Time-to-activate helps ensure users quickly reach their "aha! moment". This moment represents when users recognize the value of the product, a critical step for engagement. Beyond raw numbers, visual tools provide an additional layer of insight by mapping the user journey in real time.
Using Heatmaps and Session Replays
Visual tools like heatmaps and session replays bring depth to the story told by quantitative metrics. Heatmaps reveal interaction patterns, showing where users click or focus their attention. On the other hand, session replays provide a detailed view of individual user behaviors, helping teams understand the "why" behind drop-offs or frustrations. Together, these tools clarify the obstacles users face – whether it’s confusing mandatory fields, broken buttons, or other friction points.
"Heatmaps show where users click and focus attention… Session Replay shows how they move through your product in real time. Together, they help you understand not just what happened, but why." – Mixpanel
Patterns like excessive scrolling, hesitation, or backtracking often indicate user frustration. Watching just 6–8 session replays per user segment is typically enough to uncover consistent issues and behavioral trends. A good starting point is funnel analysis to identify high-drop-off steps, followed by replaying sessions of affected users to pinpoint the root causes.
"One frustrated user is an outlier. Ten frustrated users? That’s a sign something needs improvement." – Abrar Abutouq, Product Manager
For dynamic pages with modals or dropdowns, click maps may be more effective than traditional heatmaps, as they provide precise insights into user interactions. Filtering replays by user type – such as new versus experienced users – can highlight differences in workflows, enabling tailored improvements to onboarding or UX. Sharing short, targeted clips of user struggles with stakeholders can foster empathy and accelerate decisions on necessary fixes. These visual insights act as a foundation for continuous refinement of the user experience.
Metrics for Executives: Supporting Business Decisions
Core Metrics for Executive Teams
Executives rely on concise, actionable data to make strategic decisions, rather than sifting through detailed tactical reports. The aim is to link user behavior or operational performance directly to outcomes like revenue, retention, or market position. This clarity helps reduce "decision latency", enabling leaders to act quickly – whether to seize opportunities or address issues before they escalate.
To avoid overwhelming leadership teams, focus on 5-7 key metrics that directly influence resource allocation. These metrics typically fall into two categories: leading indicators (which predict future outcomes, such as Talent Flight Risk or Strategy to Execution Lag) and lagging indicators (which confirm past performance, like Revenue or EBITDA). This streamlined approach supports better, faster decision-making.
"There is no longer time to pass decisions up and down the traditional hierarchy to receive permissions or approvals. Operating in real time helps companies sense and respond to changes in an increasingly volatile business environment." – Peter Weill, Chairman, MIT Center for Information Systems Research (CISR)
Real-time analytics are a game-changer for executives, improving operational efficiency by 10-15% and reducing mean time to resolution by 37%. Organizations that leverage advanced analytics are also 2.2 times more likely to outperform their industry peers significantly.
Metrics should translate into clear financial terms. For example, instead of reporting a high abandonment rate, frame it as "This friction point costs $2.3M in lost annual recurring revenue", making it easier for executives to prioritize resources. Similarly, focus on EBITDA quality by excluding one-time gains and currency fluctuations to ensure earnings are sustainable and cash-backed. Another critical metric is the Cost of Delay, which quantifies the financial impact of postponing strategic decisions or product launches.
Comparison Table: Executive Metrics Across Studies
The table below highlights key metrics for executives, aligning them with business goals and their measurable impact.
| Executive Metric | Business Goal Alignment | Average Impact/Significance |
|---|---|---|
| Net Revenue Retention (NRR) | Sustainable Growth | NRR > 100% indicates a self-reinforcing growth engine |
| Strategy to Execution Lag | Organizational Agility | Measures how quickly intent is turned into action |
| Customer Concentration Risk | Risk Management | Identifies dependency on a single client’s decisions |
| Conversion Efficiency | Revenue Optimization | Closing gaps can boost conversions by 15-35% |
| Leadership Bench Depth | Business Resilience | Reduces risks from unexpected leadership changes |
High-performing organizations typically limit their focus to 8-12 strategic KPIs at the executive level to avoid information overload. For example, CFOs might prioritize cash flow and profitability, while Sales VPs focus on deal velocity. Companies that assess these metrics at least every two weeks see 31% better performance in achieving their objectives.
"The most effective dashboards aren’t those with the most data, but those with the right data." – Avinash Kaushik, Digital Marketing Evangelist, Google
To meet the fast-paced needs of executives, dashboards should be designed for vertical scrolling and quick loading. Leaders often review data on the go – between meetings or while traveling. Organizations with well-designed dashboarding solutions report a 5% increase in productivity and make decisions 25% faster. These tools help ensure agile leadership in an ever-changing market.
Sage Intacct Dashboards: Role- and Process-Based Insights
sbb-itb-6e49fcd
Case Studies: PageTest.AI‘s Impact on Metric Optimization
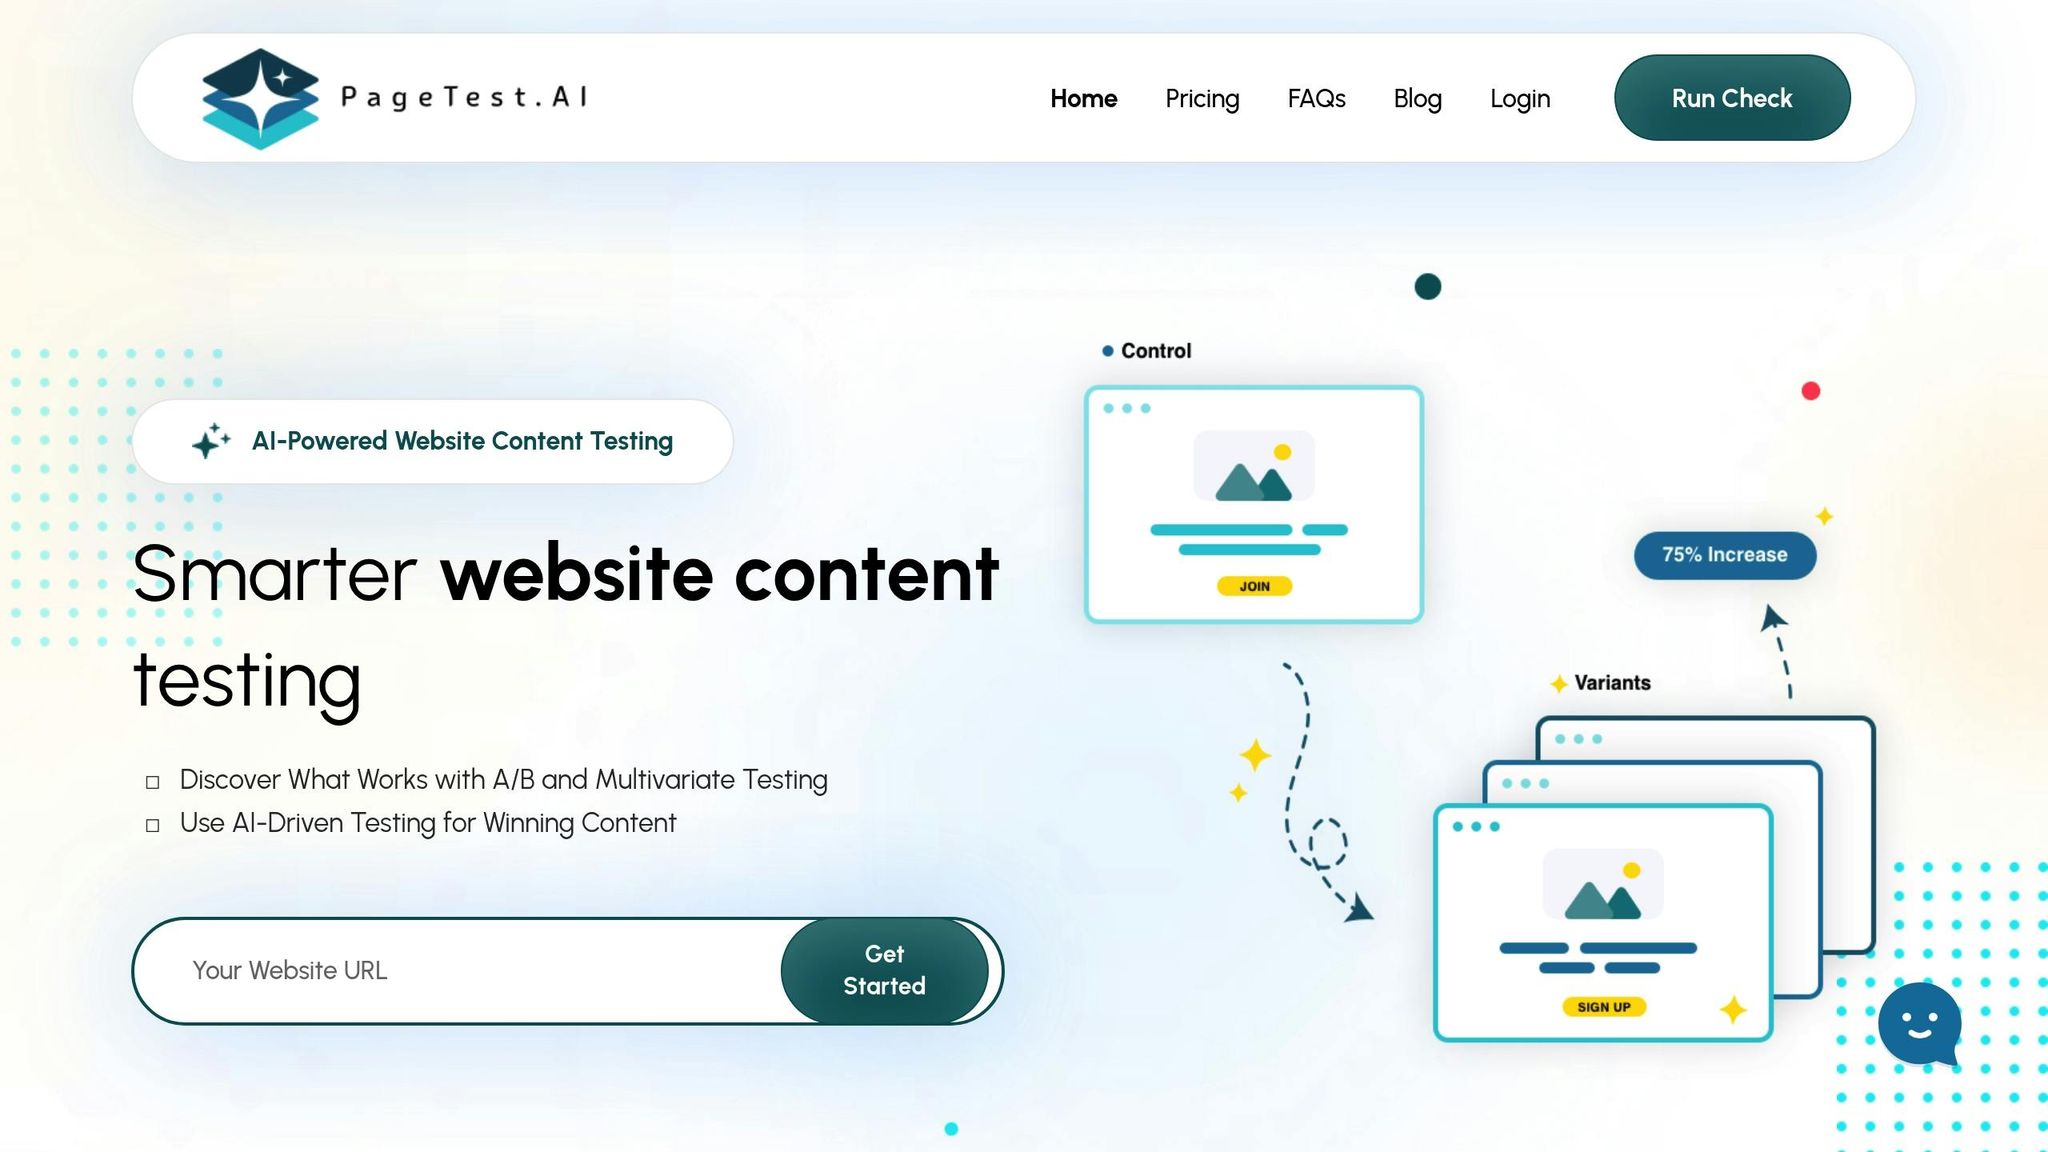
These case studies highlight how PageTest.AI has delivered measurable results for both startups and enterprises, showcasing its ability to improve key metrics and streamline decision-making.
Startup Case: Boosting Engagement Metrics
AppInstitute, a platform for mobile app development, previously relied on guesswork to optimize its call-to-action (CTA) buttons due to a lack of real-time data.
By using PageTest.AI’s Chrome extension, the team tested two CTA variations: "Make my app free and easy" and "Generate my app free." The no-code functionality allowed them to instantly create AI-powered alternatives. The results? One variation boosted engagement by an impressive 297%, while another test achieved a 220% increase in performance.
"Knowing we can test every call to action and optimize our SEO efforts is very satisfying." – David Hall, CEO, AppInstitute
With role-specific tracking, AppInstitute could analyze real-time clicks and engagement data, enabling quicker, data-driven decisions. This approach underscores how precise, real-time testing can drive significant improvements in user engagement.
While startups benefit from these rapid gains, enterprises can leverage PageTest.AI for more strategic, high-level insights.
Enterprise Case: Enhancing Executive Dashboards
A mid-sized e-commerce enterprise faced challenges in tracking key business metrics due to tools that required complex coding and had clunky, unintuitive dashboards.
PageTest.AI’s AI success engine helped the company monitor broader visitor journeys across multiple pages, connecting content performance directly to revenue outcomes. By testing product descriptions and checkout CTAs simultaneously, they identified areas causing revenue friction. The executive dashboard provided clear links between content variations and revenue, enabling faster, more informed decisions.
Since integrating PageTest.AI, the enterprise has conducted over 11,000 test impressions across 187 content variations, continuously refining its strategies with real-time data.
Research Findings and Performance Data
Measured Benefits of Real-Time Metrics
Real-time metrics tailored to specific roles can significantly improve conversion rates, efficiency, and user engagement. When dashboards and tracking are customized for particular user roles, they consistently outperform generic, one-size-fits-all approaches.
Take Navattic’s internal experiment in June 2025, led by Natalie Marcotullio, Head of Growth and Product Marketing. The team compared a standard overview demo to a persona-segmented version that allowed visitors to choose between sales, marketing, or product roles. The results? A 45% increase in "book a demo" form submissions, a 6.3x jump in Marketing Qualified Leads (MQLs), and a 25% average click-through rate – placing this demo among the top 10% on their platform.
Another example comes from HubSpot’s Pamela Vaughan, who, between December 2025 and January 2026, implemented smart content rules to replace free sign-up CTAs with demo CTAs for users already identified as free-tier customers. This simple tweak, which took just minutes to set up, led to a staggering 560% increase in demo conversion rates, climbing from 38 to 258 demo requests per month.
Operationally, real-time monitoring is a game-changer. Companies using real-time analytics report a 10–15% boost in efficiency compared to those relying on periodic reporting. For instance, energy company Vattenfall, between 2024 and 2025, streamlined its data management by introducing real-time dashboards for over 120 employees. This allowed them to monitor over 100 experiments and 2,000 monthly campaign codes in real time, resulting in a 16% conversion uplift and saving 32 hours per month previously spent on manual data exports.
"Real-time or near real-time was really a big plus to us as opposed to the exports that were available via Google’s BigQuery." – John-Paul de Rooij, Vattenfall
These advancements highlight how real-time metrics reduce friction and pave the way for no-code platforms to further enable non-technical teams.
How No-Code Solutions Simplify Metrics Optimization
No-code platforms take the benefits of real-time metrics a step further by making them accessible to non-technical users. These tools allow employees to implement, monitor, and act on data without relying on engineering teams, cutting down on complexity and saving time otherwise spent navigating external analytics tools.
For example, HubSpot’s no-code smart content rule, which was set up in minutes, drove a 560% increase in demo conversion rates. Similarly, RealVNC saw impressive results within 60 days of integrating Lift AI’s real-time behavioral intent scores. By targeting high-intent visitors with personalized pop-ups, they achieved a 10% increase in direct customer revenue, a 5% boost in their sales-assisted pipeline, and a 94% lift in click-through rates.
"The questions from the organization have gotten more advanced… so you can focus on more complex analysis and delivering value rather than simply reporting." – John-Paul de Rooij, Vattenfall
Platforms like PageTest.AI further simplify the process by offering visual editors and AI-generated content variations. These tools empower marketers, product managers, and executives to independently access the insights they need, keeping teams agile and focused while freeing up analysts for deeper, more strategic work.
Conclusion: The Impact of Role-Based Metrics
Tailoring real-time metrics to specific user roles can lead to measurable improvements in business outcomes. Companies using real-time analytics have seen a 10–15% boost in operational efficiency and a 37% reduction in mean time to resolution (MTTR) compared to those relying on periodic reporting. When employees access metrics directly tied to their responsibilities, they feel a greater sense of ownership, which translates to a 23% increase in productivity.
It’s not about having more data – it’s about having the right data for each team. For instance, marketers benefit from insights into conversion funnel performance and lead generation. Product managers need metrics like feature adoption rates and system uptime. Executives focus on financial indicators such as MRR/ARR and cash burn. By presenting each role with only the data that matters to their decisions, organizations can operate more efficiently. This approach not only simplifies decision-making but also lays the groundwork for faster problem-solving.
The advantage of real-time visibility goes beyond just speed – it enables teams to address issues proactively. This agility provides a competitive edge, with organizations that leverage advanced analytics being 2.2 times more likely to outperform their industry peers significantly.
The benefits also extend to collaboration and alignment. When employees from different roles access tailored views of the same real-time data, it fosters a shared understanding across departments. Employees who see how their work contributes to broader company goals are 3.5 times more likely to feel engaged. This alignment significantly increases the chances of achieving top-tier financial performance, making role-based metrics essential for modern businesses.
The evidence is clear: providing accessible, role-specific performance insights is no longer optional – it’s a necessity. Tools like PageTest.AI deliver no-code solutions for real-time, role-tailored data, enabling teams to stay agile without relying heavily on engineering support.
FAQs
What makes a metric “real-time”?
A metric is called real-time when it updates instantly or live during experiments or user interactions. This capability allows for on-the-spot decision-making, spotting successful variations early, and quickly identifying potential problems. Tools like PageTest.AI make it possible to monitor key performance metrics – such as clicks, engagement, and user behavior – in real time, helping teams optimize more efficiently.
How do I choose the right KPIs for each role?
To choose the right KPIs, it’s essential to connect metrics directly to your business goals and the specific tasks that drive success for each role. Start by pinpointing the main objective of the role – whether that’s boosting conversions, enhancing engagement, or something else entirely. Use a primary metric to track overall success (like revenue) and secondary metrics to gain deeper insights (such as bounce rate). Make it a habit to review your KPIs regularly to ensure they align with changing priorities and objectives.
How can PageTest.AI help teams act on real-time metrics?
PageTest.AI helps teams make smarter, faster decisions by automating content testing and providing real-time performance insights. With this tool, you can quickly identify what’s working (and what’s not) and make adjustments to boost conversions. By removing the need for manual testing, it streamlines the process, allowing you to focus on improving website performance with data-backed decisions.
Related Blog Posts
say hello to easy Content Testing
try PageTest.AI tool for free
Start making the most of your websites traffic and optimize your content and CTAs.
Related Posts

![]() 30-03-2026
30-03-2026
 Ian Naylor
How Internal Links Boost Conversions
Strategic internal links guide users, improve SEO, and turn site navigation into measurable conversion growth.

![]() 28-03-2026
28-03-2026
Ian Naylor
Core Web Vitals Benchmarks by Industry
Industry Core Web Vitals benchmarks and practical fixes for LCP, INP, and CLS, plus mobile vs desktop gaps and optimization tips.

![]() 26-03-2026
26-03-2026
Ian Naylor
How to Benchmark Mobile Retention Rates
Benchmark Day 1/7/30 retention, run cohort analysis, and optimize onboarding, habit triggers, and personalization to improve app retention.