

Predictive Analytics in A/B Testing: How It Works

Predictive Analytics in A/B Testing: How It Works
![]() 23-03-2026 (Last modified: 25-03-2026)
23-03-2026 (Last modified: 25-03-2026)
Predictive analytics speeds up A/B testing by using historical data and advanced models to forecast outcomes. Instead of waiting weeks for results, you can identify likely winners within days. This approach helps you make faster decisions, reduce costs, and optimize your testing efforts more effectively.
Key Points:
- What It Does: Predicts long-term performance of variations using early experiment data.
- Why It Matters: Reduces wait times, lowers traffic requirements, and improves decision-making.
- Metrics You Can Predict: Revenue, conversions, engagement, and retention.
- How It Works:
- Start with a clear hypothesis and clean historical data.
- Train predictive models like XGBoost or Multi-Armed Bandit algorithms.
- Use tools like PageTest.AI for AI-powered content variations and real-time forecasts.
- Compare predictions with actual results to validate accuracy.
- Challenges: Requires clean data, regular model updates, and human oversight to avoid short-term bias.
Predictive analytics transforms A/B testing into a faster and more data-driven process, helping you optimize website performance with fewer resources.
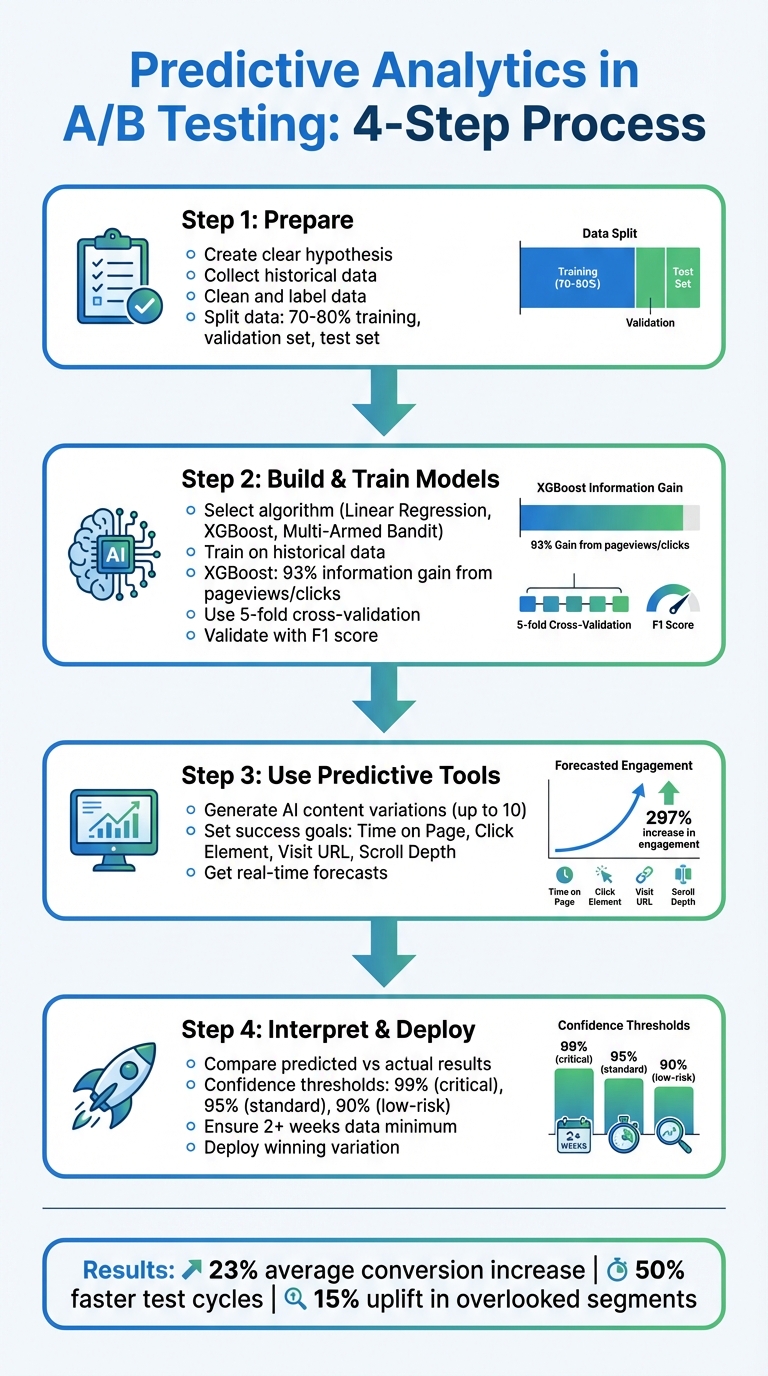
4-Step Predictive Analytics A/B Testing Process
Step 1: Preparing for Predictive A/B Testing
To get started with predictive A/B testing, you need two key ingredients: a solid, testable hypothesis and reliable historical data. Without these, even the smartest algorithms can’t produce meaningful results.
Create a Clear Hypothesis
A strong hypothesis connects the problem you’re trying to solve with a potential solution. Start by pinpointing where users are dropping off – maybe your call-to-action (CTA) button isn’t getting clicks, or visitors are abandoning your pricing page. Use tools like Google Analytics or heatmaps to confirm the issue.
Your hypothesis should be straightforward: "If [Independent Variable], then [Expected Outcome] because [Rationale]." For instance: "If we change the CTA button text from ‘Start your 30-day free trial’ to ‘Start my 30-day free trial,’ then click-through rates will increase by 15% because personalized language makes the action feel more relatable." This approach focuses on one variable, making it easier to measure results accurately. Testing multiple elements at once muddles the data, leaving predictive models unable to pinpoint what caused any changes.
The reasoning behind your hypothesis is just as important as the change itself. Back in 2025, conversion copywriter Michael Aagaard tested this exact tweak for a client and achieved a 90% increase in sign-ups simply by swapping "your" for "my". Similarly, the travel company Going adjusted their CTA language and saw a 104% jump in conversions.
Once your hypothesis is ready, the next step is gathering the historical data needed to fuel your predictive models.
Collect Historical Data
Predictive models thrive on high-quality historical data. You’ll need both quantitative metrics (like clicks or session durations) and qualitative insights (such as session recordings or user feedback). It’s crucial that this data is labeled with clear outcomes – like "converted" or "not converted" – so the algorithm can learn what success looks like.
Before using the data, clean it thoroughly. This means filling in missing fields, standardizing formats, and converting categories (e.g., "plan type") into numerical values. Collaborate with someone familiar with your business to identify the most relevant behavioral features, like average session time or login frequency, while cutting out irrelevant details.
Finally, divide your dataset into three parts:
- Training set: 70–80% of your data, used to teach the model.
- Validation set: Used for fine-tuning the model.
- Test set: Used to evaluate performance on new, unseen data.
Don’t forget to remove any personally identifiable information (PII) to ensure compliance with privacy laws. With clean, structured data and a clear hypothesis, you’re ready to move to the next step in predictive A/B testing.
sbb-itb-6e49fcd
Step 2: Building and Training Predictive Models
Now that your data is prepared and split, it’s time to create models that can forecast the outcomes of your A/B tests. This involves picking the right algorithm and training it on your historical data to uncover patterns and predict the performance of different variations.
Select the Right Algorithm
The choice of algorithm depends on your specific prediction goals. For straightforward insights, linear regression provides a baseline view, showing the direction and size of effects. If your data involves more complex, non-linear user behaviors, decision trees are a better option. For even higher accuracy, XGBoost excels at detecting intricate patterns. For instance, in one study, XGBoost attributed 93% of the information gain to features like pageviews and clicks, leaving only 7% tied directly to the experiment itself.
"A major issue with traditional, statistical-inference approaches to A/B Testing is that it only compares 2 variables—unlike multivariant testing which handles more… This is where Machine Learning excels – generating insights from complex systems."
– Matt Dancho, Data Science Instructor, Business Science
For campaigns that operate on tight timelines, such as flash sales, Multi-Armed Bandit (MAB) algorithms are ideal. These adapt in real time, redirecting traffic to the better-performing variation to reduce missed opportunities. On the other hand, simpler models might be a better fit for low-traffic websites or when interpretability is a priority, as advanced models often need large datasets to deliver reliable results.
Train Models on Test Data
Training your model starts with feeding it the training set, which usually makes up 70–80% of your historical data, along with labeled outcomes (e.g., "converted" or "not converted"). This allows the model to learn which factors – like session duration, platform type, or geographic location – are linked to success. To prevent overfitting, use an 80/20 data split and apply 5-fold cross-validation.
After training, validate the model using a separate validation set to fine-tune its parameters. Then, test it on a final test set to assess how well it performs in real-world scenarios. Metrics like the F1 score are helpful for balancing precision and recall, and predictions should only be trusted once they meet stability benchmarks. This typically happens after gathering at least two weeks of data and achieving a narrow prediction interval. Additionally, retraining your models periodically is crucial, especially following major product updates or seasonal changes.
"The model’s performance depends on the quality and representativeness of the available data. Unusual cohort behaviour or new apps not included in the training set can affect prediction accuracy."
– Adapty
With a finely tuned model in hand, you’re ready to integrate its predictions into tools like PageTest.AI, helping you turn insights into actionable website improvements.
Step 3: Using Predictive Analytics with PageTest.AI
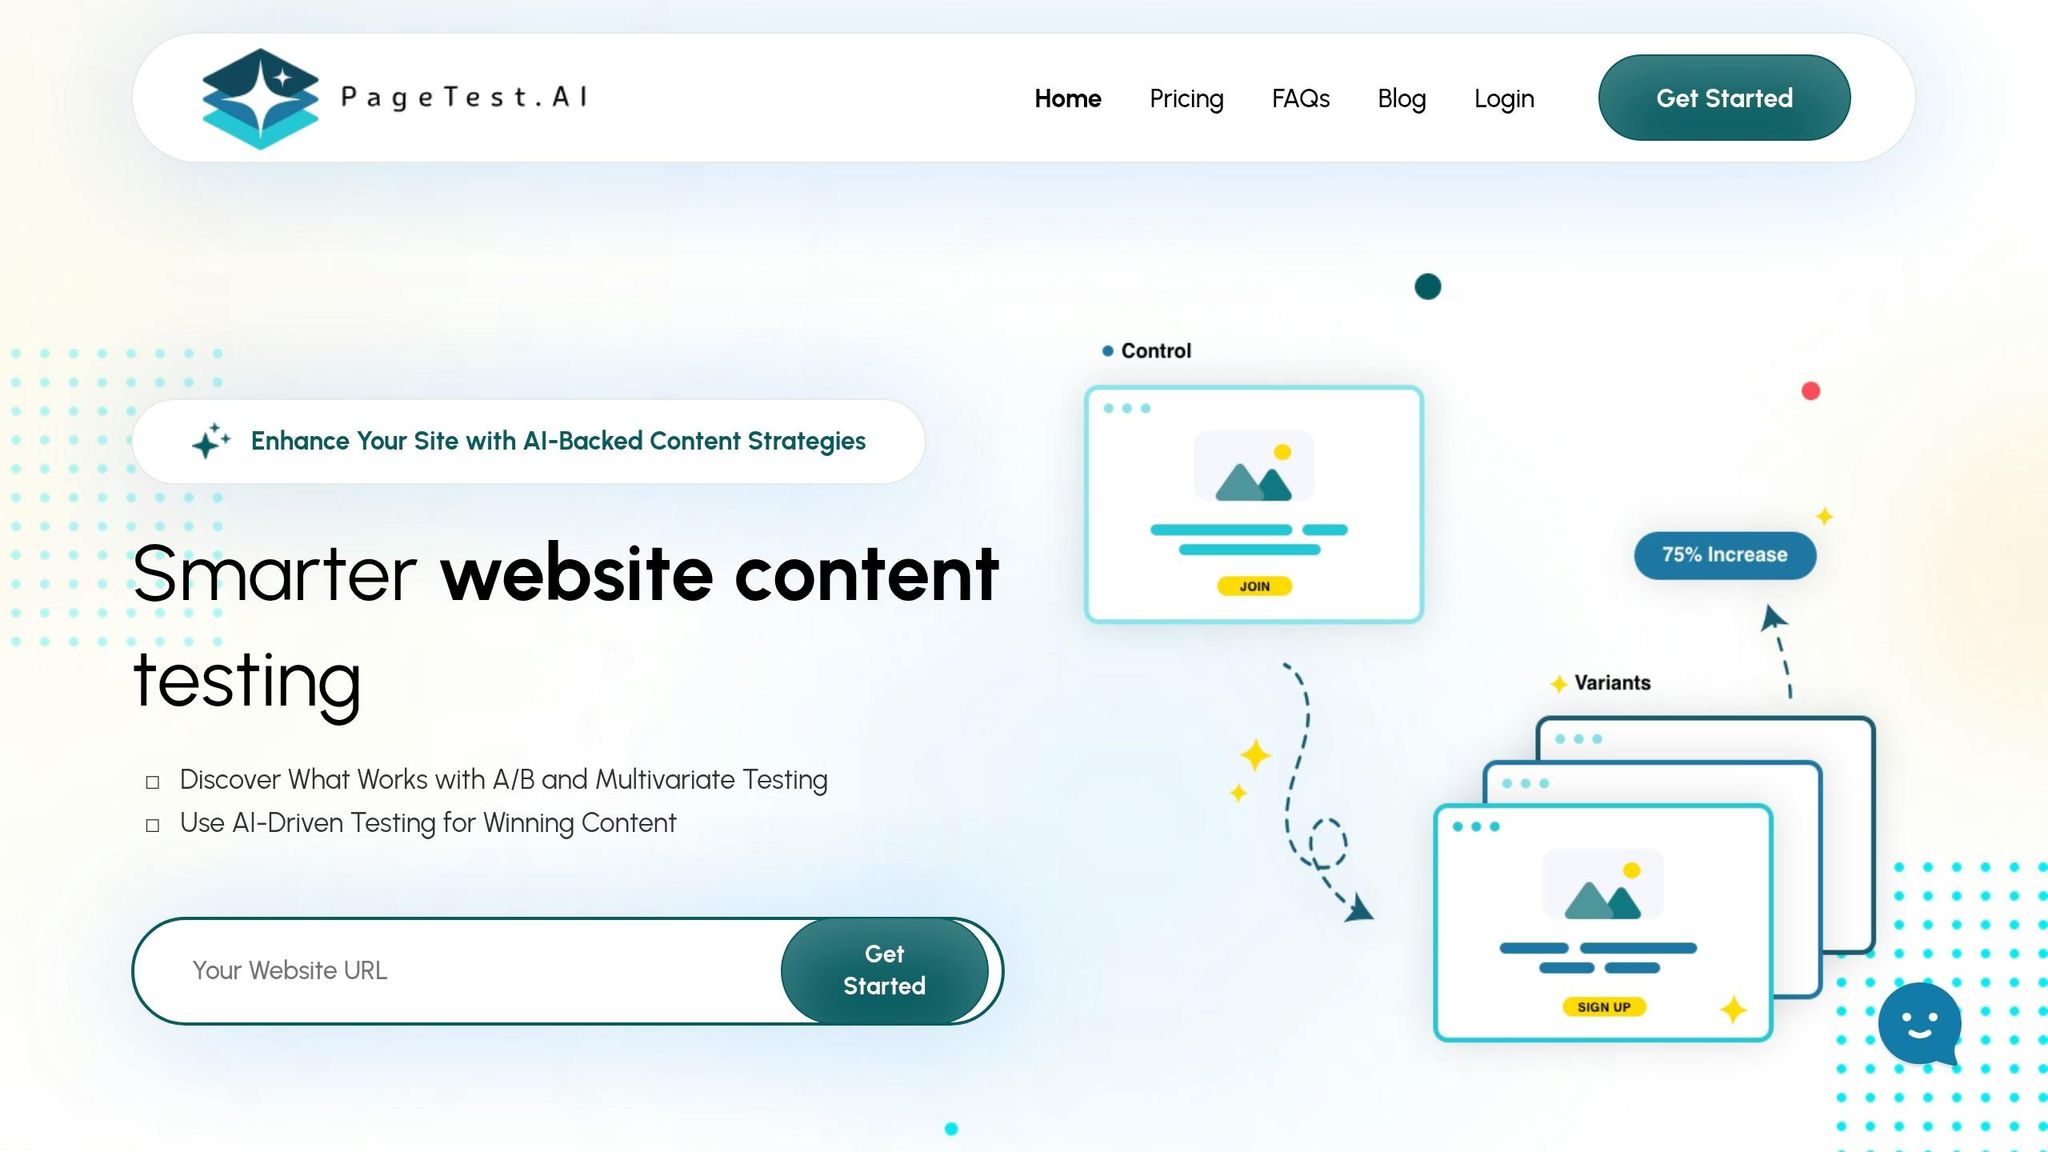
Once you’ve fine-tuned your predictive models, it’s time to let them shine. PageTest.AI takes the complexity of machine learning and turns it into actionable website optimization. With its no-code platform, you can use predictive analytics to simplify A/B testing, cutting out the tedious manual work and long wait times. Instead of waiting for weeks to see results, the platform helps you create content variations and predict their performance in advance.
Generate AI Content Variations
With the PageTest.AI Chrome extension, you can highlight any website element and instantly generate up to 10 AI-powered variations. These are crafted using real conversion data, speeding up the creative process and removing the guesswork.
For example, in a March 2026 case study, PageTest.AI tested a CTA button for an app-building service. The original button text, "Generate my app free", was compared against several AI-suggested alternatives. The top performer, "Make my app free and easy", achieved 11 clicks versus 2 for the original – a 297% increase in engagement. This test was part of a broader study involving 11,000 impressions across four websites.
"As a marketer I have struggled so much with AB testing… I love that you have a Chrome extension, it makes it so much easier!"
– Werner Geyser, Founder, Influencer Marketing Hub
If the AI-generated options don’t quite fit your brand’s tone, you can use the "Refresh unselected" button to generate new suggestions or manually edit any variation with the pencil icon. This gives you the flexibility to stay on-brand while still taking advantage of AI-driven insights.
Forecast Test Outcomes
PageTest.AI’s AI Success Engine takes the guesswork out of testing by analyzing key session data – like time on page, scroll depth, and click likelihood – to predict which variations will perform best before you fully roll them out. It even tracks multi-page journeys, helping you see how changes on one page impact the visitor’s path to critical pages, such as thank-you or registration pages.
When setting up a test, you can define a success goal from four main options: Time on Page, Click Element, Visit URL, or Page Scroll Depth. The AI then monitors these metrics in real time, providing automatic recommendations to help you quickly identify the best-performing variations without waiting for traditional statistical significance.
Here’s how the platform’s predictive metrics translate into actionable insights:
| Success Metric | Description | Predictive Value |
|---|---|---|
| Time on Page | Tracks how long visitors stay on a page | Highlights engagement levels and SEO opportunities |
| Scroll Depth | Measures how far visitors scroll | Indicates content relevance and user interest |
| Click Events | Predicts the likelihood of clicks on CTAs or links | Helps gauge conversion potential |
| Visit URL | Tracks if visitors reach specific pages | Maps the full customer journey and conversions |
For those running multiple tests on a single page, PageTest.AI includes a "Test Priority" feature. This allows you to allocate more traffic to high-priority tests while maintaining data integrity – each visitor only sees one test at a time. For example, a priority 5 test will receive five times more visitors than a priority 1 test, enabling faster insights on your most important experiments.
"Knowing we can test every call to action and optimize our SEO efforts is very satisfying."
– David Hall, CEO, AppInstitute
Getting started is simple. The platform’s Free for Life plan offers 10,000 test impressions per month, unlimited domains, and unlimited tests, making it accessible to businesses of all sizes. Setup is quick, requiring only a single JavaScript snippet or plugins for WordPress and Shopify, and you can launch your first test in just seven minutes.
Step 4: Interpreting Predictions and Making Decisions
Once your model has generated forecasts and you’ve run your tests, the next step is to evaluate how well the predictions align with actual outcomes and decide on deployment.
Compare Predicted vs. Actual Results
After testing, it’s crucial to assess how closely the forecasts match the actual results. To do this, you can use Frequentist methods like t-tests and p-values, or Bayesian analysis, which provides direct probability estimates. Bayesian methods are particularly useful for larger effects (≥5%) because they offer faster, directional insights. On the other hand, Frequentist techniques are better suited for smaller effects or situations with stricter regulatory requirements.
One thing to watch out for is the risk of inflated false positives when repeatedly checking results in Frequentist tests. To address this, consider Sequential Frequentist methods like Asymptotic Confidence Sequences (ACS), especially if you need to monitor results in real time. It’s worth noting that about 70% of A/B tests are underpowered, meaning they don’t have enough traffic to detect meaningful effects. Ryan Thomas, Co-Founder of Koalatative, emphasizes:
"An underpowered test is still underpowered even when the Bayesian CTBC [Chance to Beat Control] looks good".
Deploy Winning Variations
Once you’ve confirmed the statistical reliability of your results, it’s time to move from analysis to action. Before rolling out the winning variation, ensure the test meets these three criteria: a narrow prediction interval, sufficient data, and a minimum two-week duration. For a more comprehensive evaluation, use the P2BB metric to assess long-term performance, especially for subscription-based businesses where metrics like trial conversions and future revenue are more critical than immediate clicks.
Confidence thresholds should vary depending on the level of risk involved:
- 99% for mission-critical changes (e.g., checkout flows)
- 95% for standard optimizations
- 90% for fast-paced learning in low-risk scenarios
As Conversion Copywriter Uwemedimo Usa points out:
"A result that clears the 0.05 threshold doesn’t automatically justify rollout. Business context matters".
If the P2BB forecasts raise concerns, collect more data or investigate inconsistencies before proceeding.
Once the variation is deployed, analyze its performance to refine future tests. Predictive models using gradient boosting can achieve a Mean Absolute Percentage Error (MAPE) below 10%, providing reliable forecasts for planning your next experiments. However, for consistency in error control, avoid switching between Bayesian and Frequentist methods mid-test. By continuously analyzing the performance of deployed variations, you can fine-tune your approach and make the most of predictive analytics for future success.
Benefits and Challenges of Predictive Analytics in A/B Testing
Main Benefits
Predictive analytics speeds up decision-making and minimizes wasted traffic. Instead of waiting weeks for statistical significance, AI-powered models can predict long-term outcomes in just days. For instance, AI personalization can increase conversions by 23%, while personalized CTAs deliver 202% higher conversion rates.
Dynamic traffic allocation is another game-changer. This feature redirects traffic to winning variations in real time, cutting test durations by up to 50% and reducing conversion losses. Real-world examples back this up: Amazon‘s AI-driven personalized recommendations boosted sales by 10–15%, and Netflix saw a 20–30% increase in user engagement thanks to AI-optimized content suggestions.
AI models also excel at spotting opportunities that human analysis might overlook. For example, AI-driven insights can identify an average 15% uplift in overlooked sub-segments. This level of detail allows marketers to fine-tune strategies for specific user behaviors, such as differences between mobile and desktop usage. Automated prioritization further streamlines testing by ranking hypotheses based on potential ROI, ensuring teams focus on the most impactful experiments.
While these advantages are compelling, predictive analytics does come with its own set of hurdles.
Common Challenges
One of the biggest obstacles is data quality. Real-world datasets often include missing information, inconsistent formats, or mismatched schemas, all of which can undermine model accuracy. Without clean and representative data, predictions may become unreliable.
Another challenge is model drift. As customer behavior and market conditions evolve, AI models can become outdated, requiring frequent monitoring and retraining to stay effective. There’s also the issue of accessibility – many predictive tools are designed for data scientists, making them less approachable for standard marketing teams.
The "black-box" nature of AI models can also be problematic. When users can’t understand how predictions are made, skepticism and low adoption rates often follow. As Tracy Laranjo, CRO Strategist, puts it:
"The key is to use AI responsibly; I use it to process data more efficiently, automate repetitive tasks, and be a more concise communicator. I embrace it for the doing aspects of my job but never for the thinking aspects".
There’s also a risk of focusing too much on short-term optimization. AI might prioritize immediate clicks or conversions while neglecting long-term factors like customer retention or lifetime value if not carefully guided. Additionally, when generative AI is used to create test variations, it may produce illogical or off-brand content, necessitating human oversight.
Benefits vs. Challenges Comparison
Effectively using predictive analytics in A/B testing means balancing its advantages with its limitations.
| Benefits | Challenges |
|---|---|
| 23% average conversion increase with AI personalization | Requires large volumes of clean, high-quality data |
| Dynamic traffic allocation reduces test cycles by up to 50% | Models can grow stale and require constant retraining |
| Identifies 15% uplift in sub-segments missed by manual analysis | High expertise barrier for non-technical marketing teams |
| Automated prioritization focuses on high-ROI tests | Black-box nature reduces user trust and transparency |
| Reduces human bias through data-driven forecasts | Risk of optimizing for short-term gains over long-term health |
| Personalized CTAs convert 202% better than generic ones | Potential for AI-generated content "hallucinations" |
This table underscores the trade-offs involved in using predictive analytics. Addressing these challenges is essential to fully harness its potential in A/B testing.
Conclusion: The Future of Predictive Analytics in A/B Testing
Key Takeaways
Predictive analytics is changing the game in A/B testing, turning it into a forward-thinking process. It allows marketers to generate forecasts in days rather than weeks, leading to a 15-20% boost in marketing ROI and a 30-50% increase in conversions.
This shift from descriptive to predictive analytics moves beyond simply understanding "what happened" to predicting "what’s likely to happen next." For example, you could start by predicting a specific outcome, like identifying which leads are likely to convert within 30 days. To ensure accuracy, apply the 80/20 rule with historical data and focus on clean, consolidated datasets from your CRM, ad platforms, and website analytics.
While predictive models are powerful, they still need human oversight. Julia Moreno from Dataslayer.ai puts it best:
"Predictive analytics transforms your historical campaign data, customer behavior, and market signals into reliable forecasts about what happens next. It’s the difference between driving with GPS versus an outdated map".
These predictions should guide your decisions, not dictate them outright, especially when external factors like new product launches or seasonal trends could influence outcomes. As this technology continues to mature, its role in A/B and multi variable testing will only grow stronger.
What’s Next
Real-time updates for predictive models are becoming the norm, with tools now refreshing predictions as new data streams in from CRMs and ad platforms. No-code solutions like Google Analytics 4’s predictive audiences, HubSpot’s lead scoring, and platforms like PageTest.AI are making these capabilities more accessible. A standout example is McDonald’s Hong Kong, which used GA4’s predictive audiences in 2025 to target users "likely to purchase soon", resulting in a 550% increase in app orders and a 63% drop in cost per acquisition.
Platforms like PageTest.AI are already pushing the boundaries, enabling marketers to use real-time data for smarter, faster decision-making. The predictive analytics market is expected to hit $35.5 billion by 2027, growing at an annual rate of 21.9%. By 2025, 75% of top-performing marketing teams are projected to have predictive analytics as a core part of their strategy.
Looking ahead, marketers who combine predictive insights with their expertise will shape the future of testing. Trends like privacy-first modeling with first-party data, automated audience segmentation based on churn risk, and even weather-driven demand forecasting are on the horizon. The tools are already here – marketers just need to embrace them or risk falling behind.
FAQs
When should I use predictive analytics instead of a standard A/B test?
Predictive analytics is perfect for forecasting long-term outcomes, such as revenue potential, instead of depending solely on real-time performance data. This approach shines in scenarios involving complex tests with multiple variables or when quick, data-backed decisions are crucial. By analyzing historical data and user behavior, predictive models estimate future results, allowing you to identify the best course of action without the need for lengthy test periods.
How much historical data do I need for reliable predictions?
The volume of historical data needed varies based on the model and the context of testing. In general, having a larger dataset enhances accuracy by revealing patterns and trends in user behavior. Predictive models, in particular, rely on analyzing extensive past data to provide long-term forecasts, which can lead to more dependable results during A/B testing.
How do I avoid short-term bias when choosing a “winner” early?
To steer clear of short-term bias in A/B testing, consider using predictive analytics to project long-term outcomes rather than focusing solely on immediate results. By employing advanced machine learning models, you can estimate future performance trends, enabling more informed decisions without the need to wait for lengthy testing periods. Tools like PageTest.AI take this a step further by incorporating AI-driven content optimization, which enhances accuracy and speeds up the process – minimizing the risk of prematurely choosing a winner based on short-term variations.
Related Blog Posts
say hello to easy Content Testing
try PageTest.AI tool for free
Start making the most of your websites traffic and optimize your content and CTAs.
Related Posts

![]() 30-03-2026
30-03-2026
 Ian Naylor
How Internal Links Boost Conversions
Strategic internal links guide users, improve SEO, and turn site navigation into measurable conversion growth.

![]() 28-03-2026
28-03-2026
Ian Naylor
Core Web Vitals Benchmarks by Industry
Industry Core Web Vitals benchmarks and practical fixes for LCP, INP, and CLS, plus mobile vs desktop gaps and optimization tips.

![]() 26-03-2026
26-03-2026
Ian Naylor
How to Benchmark Mobile Retention Rates
Benchmark Day 1/7/30 retention, run cohort analysis, and optimize onboarding, habit triggers, and personalization to improve app retention.