

How to Benchmark Mobile Retention Rates

How to Benchmark Mobile Retention Rates
![]() 26-03-2026 (Last modified: 26-03-2026)
26-03-2026 (Last modified: 26-03-2026)
Retention rates are a critical measure of how well your app keeps users engaged over time. On average, mobile apps see retention rates drop from 26% on Day 1 to just 7% by Day 30. If your app’s retention rates are below these benchmarks, it’s a sign you need to improve onboarding, user experience, or long-term value.
Key Takeaways:
- Day 1, Day 7, and Day 30 Retention: Industry averages are 28.29%, 17.86%, and 7.88%, respectively.
- Retention vs. Churn: Retention shows loyalty, while churn highlights user drop-offs.
- Benchmarks by Category: Finance apps perform best (30.3% Day 1), while education apps face the biggest challenges (14-15% Day 1).
- iOS vs. Android: iOS apps consistently outperform Android in retention metrics.
How to Improve:
- Track Key Metrics: Focus on Day 1, Day 7, and Day 30 retention to understand user behavior.
- Use Cohort Analysis: Group users by install date or acquisition channel to identify trends.
- Optimize Onboarding: Deliver value within the first session to boost Day 1 retention.
- Encourage Habit Formation: Add features like streaks or reminders to improve Day 7 retention.
- Personalize Experiences: Tailor content and features to user behavior for better long-term engagement.
Retention benchmarking helps you identify where your app falls short and provides a roadmap for improvement. Focus on meeting or exceeding industry standards to keep users coming back.
Mobile Retention Metrics Explained
D1, D7, and D30 Retention Metrics
D1 (Day 1) retention tracks the percentage of users who return to your app one day after installation. This metric helps you understand if your onboarding process worked and if users found value in their first session. Globally, the average D1 retention rate is 28.29%.
D7 (Day 7) retention measures how many users come back seven days after installation. It’s a sign of whether your app is engaging enough to become a regular part of users’ routines. The global average for D7 retention is 17.86%. If users stick around after a week, it’s a good sign they’re integrating your app into their habits.
D30 (Day 30) retention looks at users who return 30 days after installing the app. This metric reflects long-term engagement and whether your app continues to deliver value. Unfortunately, the global average has dropped to just 7.88%, meaning most apps lose 70–80% of their users within the first month.
For instance, if 10 users install your app and 3 come back on Day 1, your D1 retention rate is 30%. Each day is calculated separately, so users who return on Day 2 may not be the same ones who returned on Day 1. These metrics are essential for understanding user behavior and identifying trends.
Retention Rate vs. Churn Rate
Retention and churn are two sides of the same coin. If your app has a 30-day retention rate of 15%, the churn rate for that period is 85%. Retention focuses on user loyalty and how well your app meets their needs, while churn highlights where users drop off – whether due to onboarding issues, bugs, or competition.
For subscription-based apps, it’s important to track these metrics separately for different user segments. Free user churn affects your potential audience for conversion, while subscription churn directly impacts revenue and lifetime value. A study of 37,000 apps showed that by the third month, the average retention rate falls to 27%, with a churn rate of 73%.
"Understanding your app’s retention rate, and how it stacks up to the benchmark rates seen in your vertical and across the larger mobile ecosystem, is an essential part of figuring out your customer engagement and retention strategy." – Todd Grennan, Senior Content Producer, Appboy
Comparing your retention rates to industry benchmarks can help you identify areas for improvement.
Cohort Analysis and Time Frames
Looking beyond single-day metrics, cohort analysis offers a deeper dive into user behavior over time. It groups users based on a shared starting point, like the day or month they installed your app, and tracks their activity across specific time periods. This method avoids skewed data caused by rapid user growth, which can make overall retention appear lower than it actually is.
For example, a cohort is defined by both a common starting point and a set time interval. Daily intervals work well for apps with frequent usage, while weekly or monthly intervals suit apps with longer cycles.
When analyzing user acquisition sources, it’s better to use the 24-hour relative method instead of calendar-based retention. Calendar-based retention can lead to misleading results – like counting a user as "Day 1 retained" if they install at 11:59 PM and return at 12:01 AM, even though only two minutes have passed. The relative method uses a strict 24-hour window from the exact install time, giving you a more accurate picture of user engagement.
sbb-itb-6e49fcd
Mobile App Retention: The Critical Difference Developers Miss
Industry Benchmarks for Mobile Retention Rates
Mobile App Retention Benchmarks by Category and Platform
Retention Benchmarks by App Category
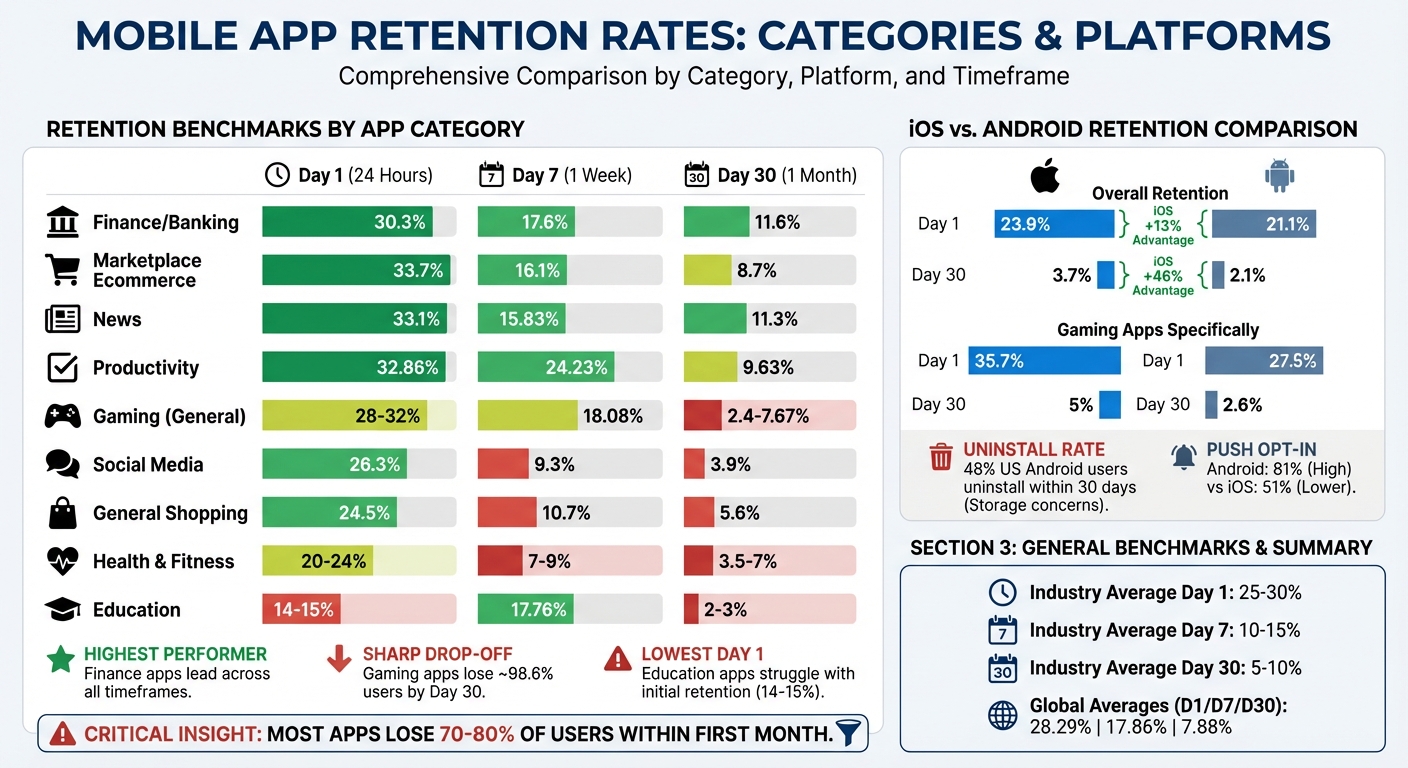
Retention rates vary significantly by app category, and understanding these benchmarks is crucial. For instance, a 20% Day 1 retention rate might be disappointing for gaming apps but is considered strong for education apps. Generally, a good mobile app retention rate falls between 25–30% on Day 1, 10–15% on Day 7, and 5–10% on Day 30.
Finance and banking apps consistently achieve the highest retention rates across all timeframes. These apps boast 30.3% Day 1 retention, 17.6% on Day 7, and 11.6% by Day 30. This success stems from their integration into users’ daily routines – checking balances, transferring money, and managing bills are frequent activities.
Marketplace ecommerce apps, like Amazon, outperform general shopping apps with a 33.7% Day 1 retention rate, compared to 24.5% for general shopping apps. The key difference lies in user behavior: marketplaces offer a wide variety of products in one place, while single-brand apps are often used only for specific purchases.
| App Category | Day 1 Retention | Day 7 Retention | Day 30 Retention |
|---|---|---|---|
| Finance / Banking | 30.3% | 17.6% | 11.6% |
| Marketplace Ecommerce | 33.7% | 16.1% | 8.7% |
| News | 33.1% | 15.83% | 11.3% |
| Productivity | 32.86% | 24.23% | 9.63% |
| Gaming (General) | 28–32% | 18.08% | 2.4–7.67% |
| Social Media | 26.3% | 9.3% | 3.9% |
| General Shopping | 24.5% | 10.7% | 5.6% |
| Health & Fitness | 20–24% | 7–9% | 3.5–7% |
| Education | 14–15% | 17.76% | 2–3% |
Gaming apps, particularly hyper-casual ones, experience the sharpest drop-offs. While Day 1 retention can reach 32.2%, these apps often lose 98.6% of users by Day 30.
Education apps face unique hurdles, with the lowest Day 1 retention at 14–15%. This is largely due to the effort required for learning. Unlike passive experiences offered by apps like news readers or social media, education apps demand active engagement and consistent effort. Users often need to build habits before they see meaningful results.
iOS vs. Android Retention Differences
When comparing retention rates, iOS consistently outperforms Android across all timeframes. On Day 1, iOS retains 23.9% of users, while Android lags behind at 21.1%, marking a 13% advantage. By Day 30, this gap widens, with iOS retaining 3.7% of users compared to Android’s 2.1%, a 46% difference.
Gaming apps highlight this disparity even further. iOS gaming apps achieve 35.7% Day 1 retention, significantly higher than Android’s 27.5%. By Day 30, iOS retains 5%, while Android drops to just 2.6%. This difference is often attributed to iOS’s uniform hardware, wealthier user base, and fewer storage constraints.
Android, however, faces challenges due to its fragmented ecosystem. Many users on lower-end devices uninstall apps to free up storage – 48% of US users uninstall apps within 30 days, with storage concerns being a primary reason. This makes it critical for Android apps to streamline onboarding and optimize performance for devices with limited resources.
Interestingly, Android users tend to engage more with push notifications, with 81% opting in, compared to 51% on iOS.
How to Benchmark Your Retention Rates
Step 1: Define Your User Cohort
To start benchmarking your mobile app’s retention, the first step is to define user cohorts that reflect your target audience’s behavior. A cohort is essentially a group of users who downloaded and installed your app within a particular timeframe – this could be a day, a week, or even a month. By grouping users this way, you can track and analyze how their behavior changes over time.
You can take this a step further by segmenting cohorts based on platform, acquisition channel, or geographic region. This level of detail can help you understand which sources bring in users who are more likely to stick around. For example, GetYourGuide discovered that TV campaigns attracted users with higher long-term value.
Make sure your cohort size is large enough to provide accurate insights. Small cohorts can lead to misleading percentage changes, so having a sufficiently large sample is critical. Once your cohorts are in place, use a consistent formula to calculate retention rates.
Step 2: Calculate Your Retention Rates
Retention rates can be calculated using this formula:
(Active Users in Period N ÷ Cohort Size) × 100.
Key intervals to monitor include:
- Day 1: Measures onboarding effectiveness.
- Day 7: Indicates habit formation.
- Day 30: Assesses product-market fit.
For instance, imagine 1,000 users install your app on a Monday, and 260 of them use it again on Tuesday. Your Day 1 retention rate would be:
(260 ÷ 1,000) × 100 = 26%.
Continue tracking this group on Days 7 and 30 to evaluate how well users remain engaged with your app over time.
Focus on non-cumulative retention (daily return rates) rather than cumulative retention. This approach provides a clearer picture of daily engagement trends. Once you’ve calculated these rates, you can move on to comparing your app’s performance with industry benchmarks.
Step 3: Compare Against Industry Data
Retention benchmarks vary by app category, so it’s important to use data relevant to your specific vertical. For example, a fintech app with a Day 1 retention rate of 20% would fall short of the industry average of 30.3%. On the other hand, a shopping app hitting 24.5% on Day 1 would be performing as expected.
"Understanding your app’s retention rate, and how it stacks up to the benchmark rates seen in your vertical and across the larger mobile ecosystem, is an essential part of figuring out your customer engagement and retention strategy."
- Todd Grennan, Senior Content Producer, Appboy
To access reliable benchmark data, look to Mobile Measurement Providers like Adjust, AppsFlyer, or Kochava. These platforms compile attribution data and offer unbiased comparisons across various app categories and regions.
Tools for Measuring and Benchmarking Retention
Analytics Platforms for Retention Tracking
Amplitude stands out as a platform that tracks billions of user interactions using its proprietary "Behavioral Graph". With its Retention Analysis charts, you can calculate retention for distinct cohorts and view usage patterns over time, making it easier to identify trends. Amplitude also offers a benchmarking tool that compares data across 17 industries and 102 countries, drawing from a behavioral database of over 2,600 companies. Additionally, its Compass feature identifies early user behaviors that signal long-term retention potential.
Mixpanel focuses on engagement analysis to evaluate product-market fit. It also publishes the "State of Digital Analytics" report, which provides benchmarks across eight key industries, such as Mobile Gaming, Fintech, and Ecommerce. For example, Mixpanel’s 2026 report highlighted that North America’s stickiness rate (DAU/MAU) reached 21%, while the APAC region saw a one-week retention increase of 86% year-over-year in mobile gaming.
When selecting an analytics platform, it’s important to prioritize flexible retention definitions. Features like N-Day (returning on a specific day), Unbounded (returning on or after a specific day), and Bracket retention (returning within specific time intervals) are critical. Behavioral cohort analysis is another key feature, offering insights into which product elements foster user loyalty.
These tools provide detailed retention insights, setting the stage for actionable strategies. Next, let’s explore how PageTest.AI uses these insights to enhance retention.
Using PageTest.AI for Retention-Driven Optimization
While analytics platforms measure retention, PageTest.AI takes it a step further by helping you improve it. This platform focuses on refining content and user experience elements that encourage users to return. With its AI-powered testing capabilities, you can experiment with variations in headlines, CTAs, button text, and product descriptions across your app’s web presence and onboarding processes.
PageTest.AI’s no-code solution tracks metrics like clicks, engagement, time spent on a page, and scroll depth – key indicators of user interest that often align with retention. By testing different messaging approaches, you can craft experiences that encourage repeat visits. This hands-on optimization complements your analytics efforts, turning insights into measurable improvements.
How to Interpret and Act on Your Results
What Your Retention Rates Mean
Retention rates reveal where users are dropping off and why. Across app categories, the average benchmarks are 25.3% for Day 1, 11–12% for Day 7, and 5–6% for Day 30. Falling below these numbers suggests you’re losing users faster than expected.
Each retention milestone tells a different story. Day 1 retention reflects how well your onboarding process resonates – did users experience value during their first session?. Day 7 retention highlights whether your app is becoming part of a user’s routine. A steep drop between Days 1 and 7 suggests users didn’t find a reason to return. Finally, Day 30 retention measures your app’s staying power – whether it delivers ongoing value that keeps users engaged.
The shape of your retention curve is equally important. A healthy curve typically dips 15–20% in the first two days and levels off by Days 7–14. If your curve keeps declining without stabilizing, it could indicate a deeper issue with product-market fit.
These numbers and patterns serve as a roadmap, showing where users leave and which parts of your app need attention.
Finding the Root Causes of Poor Retention
Once you’ve identified retention trends, it’s time to dig into the reasons behind them.
"The most common metric is Day 1 retention. It’s one of the first signals that helps you identify if a source is good or not." – Roman, Tenjin
Low Day 1 retention often points to onboarding challenges. Users may not be reaching the "aha moment" quickly enough. Top-performing apps deliver their core value in under 60 seconds, while slower apps take 5+ minutes – or never get there.
If Day 7 retention drops sharply after a strong Day 1, the issue lies in habit formation. Users tried your app but didn’t find a compelling reason to come back. Consider adding features like streaks, rewards, or progress tracking to encourage repeat visits. Apps that release updates every 14–21 days see 33% better retention, as fresh content keeps users engaged.
Day 30 drop-offs often signal deeper flaws in your app’s core value proposition.
"If people drop off on Day 1, it’s a marketing problem. If they vanish by Day 30, it’s a product problem." – Andrii N., Enable3
Behavioral segmentation can help uncover what’s driving retention. Compare users who complete key actions – like finishing a tutorial – to those who don’t. This analysis can reveal which behaviors predict long-term engagement.
Technical performance also plays a big role. High crash rates or slow API responses can lead to immediate churn. Aim for a crash-free rate above 99% and API response times under 1 second to avoid frustrating users and triggering "rage uninstalls."
Prioritizing Your Improvements
Start by tackling the earliest stages of your funnel. If your Day 1 retention is below 20%, focusing on Day 30 features won’t help – you need to fix onboarding first. Reduce friction by shortening sign-up forms, offering social login options, and ensuring users quickly achieve a meaningful outcome in their first session.
Once Day 1 retention stabilizes, shift your focus to Day 7. Introduce habit-forming features like streaks or personalized reminders. For example, Duolingo uses streak mechanics and "We miss you" notifications to encourage repeat usage. They also pause notifications for inactive users to avoid being seen as annoying, preserving future re-engagement opportunities. Push notifications can be especially effective – users who receive at least one in the first 90 days are 3x more likely to stay, with weekly notifications boosting retention by 440%.
For Day 30 retention, personalization is key. Tailor the experience based on user behavior. Personalized onboarding can increase retention by 30–50%. Blinkist, for instance, uses clear "How your free trial works" screens to reduce payment friction and guides users to their first interactive win right after registration with helpful hints and placeholders.
Focus on the biggest gaps between your retention rates and industry benchmarks. For example, if your finance app has a Day 1 retention of 20% while the category average is 30.3%, that’s where you should start. Use A/B testing to validate changes – 82% of free trial conversions happen on installation day, so even small improvements to onboarding can make a big difference.
Conclusion: Using Benchmarking for Long-Term Growth
Key Takeaways
Benchmarking is a powerful tool to guide your app toward steady and sustainable growth. While acquiring users gets your app noticed, retaining them is what drives lasting success. By analyzing metrics like D1, D7, and D30 retention, you can pinpoint where users drop off and uncover the reasons behind it. This helps you identify whether the issue lies in onboarding or deeper product-market fit challenges.
Retention is also far more cost-effective than acquisition – keeping a user can cost up to five times less than gaining a new one. Yet, apps often lose over 80% of their users within the first week. Regular benchmarking against industry standards allows you to determine whether your struggles are due to internal product issues or external market factors.
Smart teams use benchmarking to make informed decisions, such as allocating budgets to channels that bring in loyal users, optimizing onboarding to deliver an immediate "aha moment", and incorporating features like streaks or personalized notifications to encourage habitual use. Achieving technical reliability is also key – aim for crash-free rates above 99%. Tools like PageTest.AI can assist in fine-tuning content elements like onboarding headlines and call-to-action text by leveraging AI to analyze engagement and user behavior.
These insights give you the tools to make actionable, data-driven improvements.
Next Steps
Start by tracking retention using the 24-hour relative method for precise engagement data. Set up automated dashboards to monitor D1, D7, and D30 retention monthly, breaking it down by cohort and acquisition channel. This approach avoids relying on aggregate averages, which can mask important details.
"Retention numbers are meaningless if you’re not measuring them regularly." – Tenjin
Compare your app’s performance to established benchmarks and focus on closing the biggest retention gaps first. If your Day 1 retention is under 20%, streamline the onboarding process to deliver value faster. Once that improves, shift focus to building habits by Day 7 and eventually achieving product-market fit by Day 30. Test changes methodically, measure their impact, and let the data guide your adjustments.
Tools like PageTest.AI can further help by using AI-powered testing to refine your app’s content and accelerate retention improvements.
"Downloads are vanity. Retention is reality." – Andrii N., July 1, 2025
FAQs
Should I use calendar-day or 24-hour retention?
The choice hinges on what you want to achieve with your app. Calendar-day retention looks at user activity on specific days, such as Day 1 or Day 7, making it useful for understanding long-term user behavior. On the other hand, 24-hour retention measures whether users come back within the first 24 hours, which is more about gauging how well your app hooks users early on.
If you’re aiming for quick insights into onboarding and initial engagement, go with 24-hour retention. For tracking patterns and trends over time, calendar-day retention is the better option.
What cohort segments should I benchmark first?
When benchmarking cohort segments, it’s smart to start with groups defined by their start points, such as the sign-up date or the month of their first session. By examining users who began using the app during the same period, you can uncover patterns in retention and churn. This approach reveals trends in user engagement and helps evaluate the impact of updates or marketing campaigns over time.
How can PageTest.AI help improve retention?
PageTest.AI helps businesses hold onto their users by leveraging AI to study behavior, identify churn risks, and tailor outreach efforts. It builds dynamic user segments and sends automated, timely messages that resonate with users, increasing retention rates by as much as 35%. With no-code testing capabilities and real-time dashboards, teams can swiftly spot usability problems, refine user experiences, and implement strategies that keep users coming back.
Related Blog Posts
say hello to easy Content Testing
try PageTest.AI tool for free
Start making the most of your websites traffic and optimize your content and CTAs.
Related Posts

![]() 30-03-2026
30-03-2026
 Ian Naylor
How Internal Links Boost Conversions
Strategic internal links guide users, improve SEO, and turn site navigation into measurable conversion growth.

![]() 28-03-2026
28-03-2026
Ian Naylor
Core Web Vitals Benchmarks by Industry
Industry Core Web Vitals benchmarks and practical fixes for LCP, INP, and CLS, plus mobile vs desktop gaps and optimization tips.

![]() 24-03-2026
24-03-2026
Ian Naylor
5 Benefits of AI-Generated Landing Page Variations
AI creates and tests landing page variations faster, boosts personalization and conversions, delivers real-time insights, and optimizes performance across devices.