

User Behavior Impact Calculator
User Behavior Impact Calculator
![]() 10-02-2026 (Last modified: 16-02-2026)
10-02-2026 (Last modified: 16-02-2026)
Unlock Website Success with User Behavior Insights
Traffic is easy to measure. Revenue is obvious.
What sits in between is where most businesses lose clarity.
That middle layer – user behaviour – is what actually determines whether visitors convert or disappear.
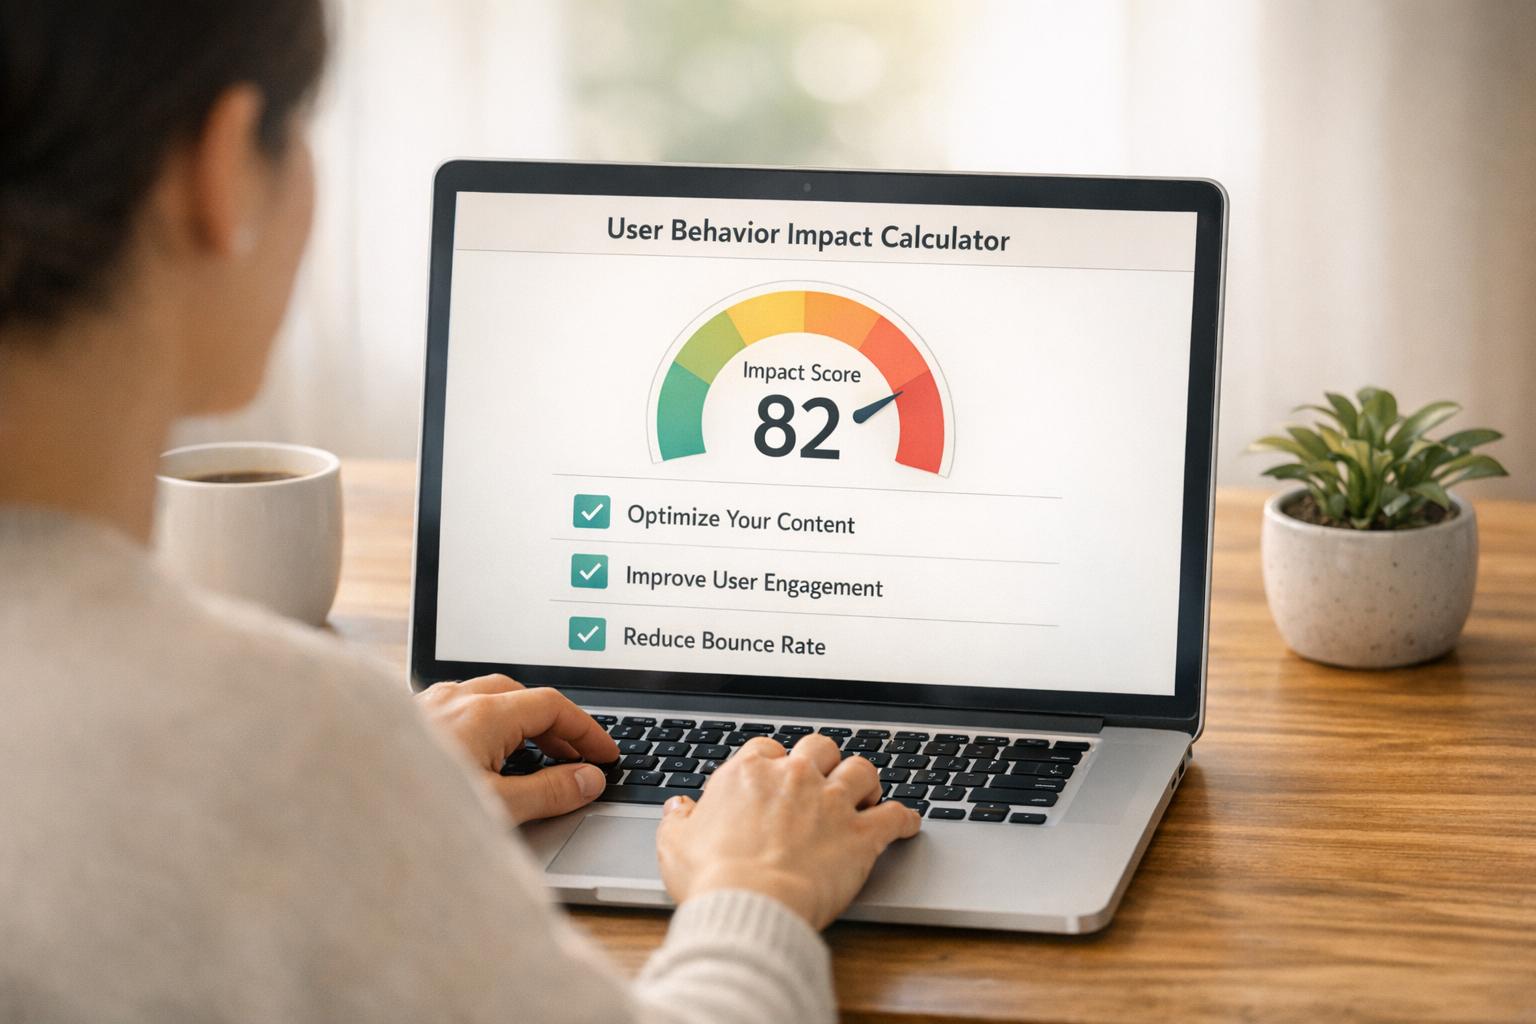
A User Behavior Impact Calculator helps you quantify how changes in engagement metrics affect your bottom line. Instead of treating bounce rate, time on page, or click-through rate as abstract numbers, you see their real business impact.
Because behaviour isn’t just a metric… It’s leverage.
Why does user behaviour matter more than traffic?
More traffic doesn’t automatically mean more customers.
You can double visitors and see no revenue change if:
-
bounce rate stays high
-
CTAs aren’t clicked
In our experience, improving user behaviour metrics often delivers better ROI than increasing traffic volume.
We’ve seen sites increase revenue simply by improving engagement by a few percentage points. The traffic stayed the same. The behaviour improved.
That’s the difference between growth and noise.
What does a User Behavior Impact Calculator actually measure?
A User Behavior Impact Calculator connects engagement metrics to financial outcomes.
It helps you model how changes in:
-
bounce rate
-
click-through rate
-
time on page
-
interaction depth
-
conversion rate
…translate into revenue impact.
Instead of asking:
“How do we reduce bounce rate?”
You start asking:
“If bounce rate drops by 5%, how much more revenue could that produce?”
That shift changes how teams prioritise optimisation.
How do small behaviour changes create big revenue shifts?
Small improvements compound.
For example:
-
A 3% lift in click-through
-
A 4% lift in on-page engagement
-
A 2% lift in conversion
Individually, those feel minor. Together, they can significantly increase revenue without any additional ad spend.
We’ve seen teams focus on headline tweaks, CTA placement, or layout adjustments and unlock disproportionate results. Becky Halls, Strategist at PageTest.ai
The key isn’t redesigning everything. It’s reducing friction in the right place.
Why do businesses underestimate behavioural impact?
Because behaviour feels soft.
Revenue feels concrete. Rankings feel visible. Engagement feels abstract.
In reality:
-
Behaviour predicts conversion
-
Engagement signals friction
-
Click patterns reveal confusion
We’ve found that engagement metrics often move before revenue does. They act as early indicators. Ian Naylor, Founder at PageTest.ai
When scroll depth drops, conversions often follow. When click maps show hesitation, signups stall soon after.
The calculator helps make that connection visible.
How should you use a User Behavior Impact Calculator?
A practical workflow looks like this:
-
Gather baseline metrics
Bounce rate, CTR, conversions, revenue. -
Model realistic improvements
What happens if bounce drops 5%?
What if CTR improves 3%? -
Identify the highest-leverage metric
Which behaviour change moves revenue most? -
Test one variable at a time
Headlines, CTAs, layout, structure. -
Recalculate and refine
In our experience, this process prevents wasted effort. Instead of optimising randomly, you focus where impact is highest.
Where does testing fit into behaviour optimisation?
Testing turns projections into proof.
Once you’ve identified which behavioural metric has the biggest potential impact, you can test:
-
headline clarity
-
CTA wording
-
page structure
-
section order
-
trust signals
-
form length
We’ve seen behavioural gains come from surprisingly small adjustments – moving a CTA, clarifying a benefit, shortening an intro.
The calculator gives you the “why.”
Testing gives you the “what works.”
Can this work for small businesses too?
Absolutely.
You don’t need millions of visitors. Behaviour modelling works at any scale because it’s about percentage change, not raw numbers.
For smaller businesses, behavioural optimisation is often the fastest way to grow without increasing ad spend.
In our experience, smaller sites benefit even more because improvements are easier to measure and implement.
Final takeaway
If you’re serious about growth, stop asking only:
“How do we get more traffic?”
Start asking:
“What happens if more of our existing visitors behave differently?”
A User Behavior Impact Calculator helps you see the revenue impact behind engagement metrics.
Because better behaviour isn’t a vanity improvement.
It’s a growth strategy.
say hello to easy Content Testing
try PageTest.AI tool for free
Start making the most of your websites traffic and optimize your content and CTAs.
Related Posts

![]() 30-03-2026
30-03-2026
 Ian Naylor
How Internal Links Boost Conversions
Strategic internal links guide users, improve SEO, and turn site navigation into measurable conversion growth.

![]() 28-03-2026
28-03-2026
Ian Naylor
Core Web Vitals Benchmarks by Industry
Industry Core Web Vitals benchmarks and practical fixes for LCP, INP, and CLS, plus mobile vs desktop gaps and optimization tips.

![]() 26-03-2026
26-03-2026
Ian Naylor
How to Benchmark Mobile Retention Rates
Benchmark Day 1/7/30 retention, run cohort analysis, and optimize onboarding, habit triggers, and personalization to improve app retention.