

Checklist for A/B Testing CTA Placement

Checklist for A/B Testing CTA Placement
![]() 03-02-2026 (Last modified: 03-02-2026)
03-02-2026 (Last modified: 03-02-2026)
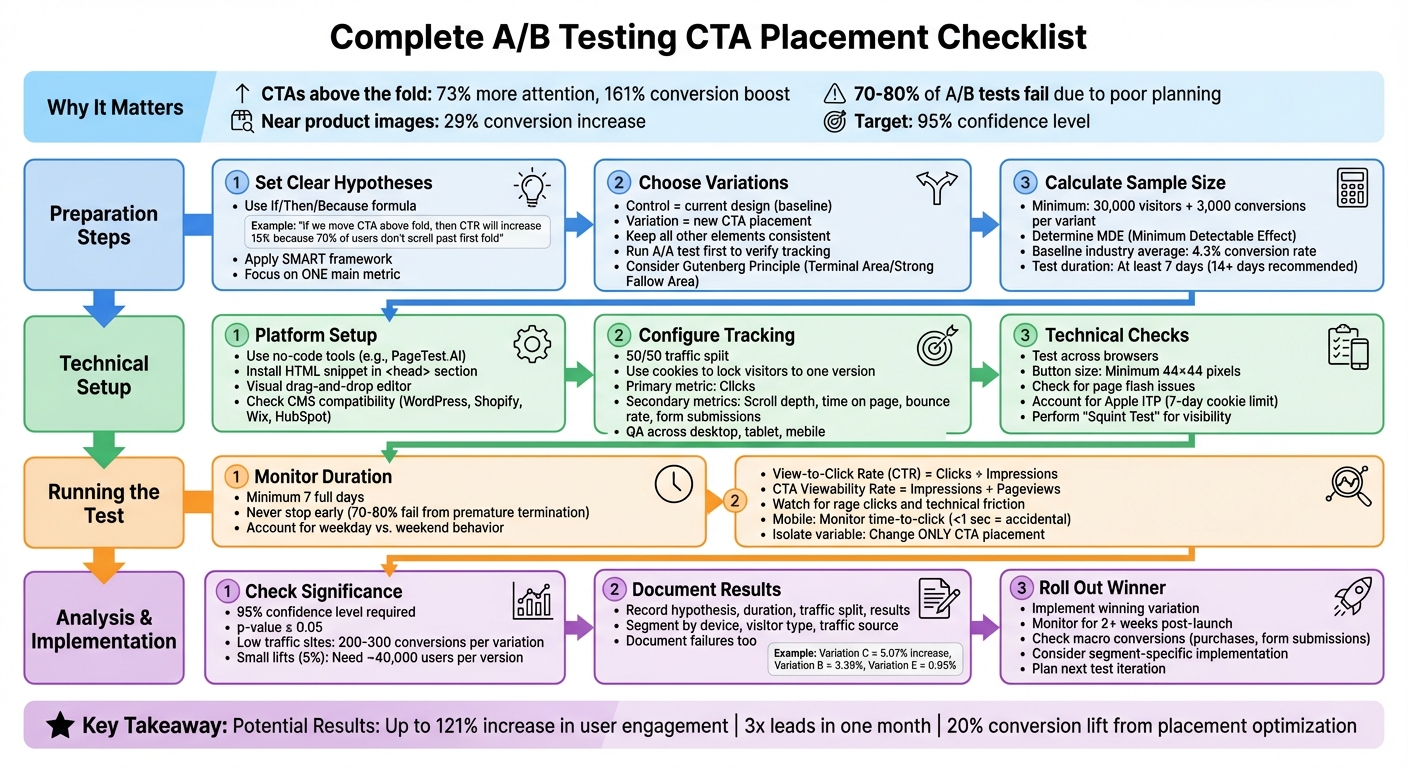
A/B testing your CTA placement can significantly improve your website’s conversion rates. But most tests fail due to poor planning or insufficient data. Here’s what you need to know:
- Position Matters: CTAs above the fold grab 73% more attention and can boost conversions by 161%. Placement near product images increases conversions by 29%.
- Testing Challenges: 70–80% of A/B tests fail due to early termination or false positives. Proper setup and clear hypotheses are essential.
- Preparation Steps: Define a data-driven hypothesis, focus on one metric (e.g., click-through rate), and calculate sample size to ensure reliable results.
- Tools and Setup: Use no-code platforms like PageTest.AI for easy adjustments and accurate tracking. Ensure compatibility with your CMS and analytics tools.
- Key Metrics: Track clicks, view-to-click rate, scroll depth, and bounce rates. Run tests for at least 7 days to account for weekly behavior patterns.
- Statistical Significance: Aim for a 95% confidence level and document results to guide future tests.
CTA placement testing is not a one-time effort. It’s a process of learning and refining to achieve measurable improvements in user engagement and conversions.
“We’ve seen teams redesign CTAs endlessly when the real issue was placement. Just moving the same button higher on the page often outperformed a complete visual redesign.” Ian Naylor, PageTest.ai
Complete A/B Testing CTA Placement Workflow: From Hypothesis to Implementation
6 A/B Testing Case Studies That Worked Insanely Well
Before You Start: Preparation Steps
Getting ready for a test is crucial. You’ll need to define clear hypotheses, create distinct variations, and calculate traffic requirements before experimenting with CTA placement. Let’s break it down step by step.
Set Clear Hypotheses and Goals
A strong hypothesis isn’t just a guess – it’s a prediction grounded in data. To craft one, include three elements: the problem (the “why”), the proposed solution (the “how”), and the expected outcome (the “what”). For example: “If we move the CTA above the fold, then click-through rates will increase by 15% because 70% of users don’t scroll past the first fold”.
Your hypothesis should rely on both quantitative data (like bounce rates) and qualitative insights (like scroll maps showing where users stop scrolling). Using the “If/Then/Because” formula can help keep your hypothesis focused and easy to test. Stick to one main metric – like click-through rate for CTA placement tests – and track secondary metrics, such as time on page, to catch any unintended downsides.
“A solid test hypothesis is an informed solution to a real problem – not an arbitrary guess.” – Josh Gallant and Michael Aagaard, Unbounce
When setting goals, apply the SMART framework: Specific, Measurable, Achievable, Relevant, and Timely. Instead of vague objectives like “improve user experience”, aim for something concrete, such as “Increase CTA click-through rate from 3.5% to 5% within two weeks.”
Once your hypothesis and goals are defined, it’s time to outline your control and test variations.
Choose Your Control and Test Variations
The control is your current design and serves as the baseline. The variation (or challenger) is the new design where the CTA placement is adjusted. To keep your test results clean, ensure all other elements remain consistent.
“Avoid testing multiple variables at the same time. … Keep it simple so success is easier to trace.” – Carly Stec, Team Manager for Blog and Academy Acquisition, HubSpot
When designing variations, consider visual hierarchy principles. For instance, the Gutenberg Principle suggests placing CTAs in areas where the eye naturally gravitates, such as the “Terminal Area” (bottom right) or “Strong Fallow Area” (top right). If your site gets heavy traffic, you might want to test on new visitors first, as they’re less likely to resist changes compared to returning users.
Before diving into your main test, conduct an A/A test. This involves comparing two identical versions to confirm your testing software is correctly splitting traffic and recording data accurately.
Calculate Sample Size and Traffic Needs
Without enough data, your test results won’t be reliable. Start by determining your Minimum Detectable Effect (MDE) – the smallest change that matters to your goals. For example, if your baseline conversion rate is 4.3% (the industry average) and your MDE is 10%, the test will detect changes outside the 3.87% to 4.73% range.
“If your sample size is too small, your test results will not be adequately powered to detect a meaningful effect. In other words, the results may appear exaggerated, inaccurate, and will not truly represent how your entire audience actually behaves.” – Deborah O’Malley, M.Sc, GuessTheTest
To ensure reliable results, aim for at least 30,000 visitors and 3,000 conversions per variant. Calculate how long your test will take by dividing the total required visitors by your daily traffic. For instance, if you need 60,000 visitors and average 3,000 daily, the test will take 20 days. Plan for at least two full weeks to account for weekday versus weekend behavior. If your traffic is on the lower side, stick to two versions to reach statistical significance faster.
Technical Setup: Configure Your Test
Once your hypothesis is ready and you’ve figured out your traffic requirements, it’s time to set up your test. The process doesn’t have to be overwhelming – especially if you use the right tools and follow a structured approach.
Use a No-Code Testing Platform
Gone are the days when you needed coding skills to adjust CTAs. Tools like PageTest.AI make it easy with visual editors that let you drag and drop elements to create both your control and variation. All it takes is installing a single HTML snippet in your website’s <head> section, and you’re ready to start editing visually. These editors allow you to reposition CTAs, tweak spacing, or even test multiple placements at once. For those running tests across several pages or sites, consider plans that support bulk testing.
One of the biggest perks of no-code platforms is how quickly you can make changes. For example, HubSpot’s Marketing Manager AJ Beltis shared that his team tested small adjustments to anchor text CTAs over time. By combining these incremental improvements, they eventually landed on a version that significantly boosted their annual leads. Starting small and iterating quickly is key, and no-code tools make that process seamless.
Set Up Traffic Splits and Event Tracking
With your testing platform ready, the next step is configuring the environment for unbiased data collection. Start with an even traffic split – usually 50/50 between your control and variation – to ensure a fair comparison. Use cookies to lock each visitor into one version throughout the test.
Define your success metrics carefully. For a CTA placement test, clicks should be your primary focus, but don’t stop there. Keep an eye on secondary metrics like scroll depth, time on page, and form submissions to catch any unintended side effects. Add tracking codes to capture these user engagement behaviors.
Before launching, conduct a detailed QA review. Check that all goals trigger correctly, URLs are accurate, and the test works smoothly across desktop, tablet, and mobile views. Make sure the testing snippet is placed before other analytics or heat mapping codes to avoid tracking conflicts. If your testing platform limits event tracking, set up alerts to ensure consistent data capture.
Finally, confirm that your testing tool integrates smoothly with your website’s technical setup.
Check Technical Compatibility
Not every testing tool works seamlessly with all website platforms. Check that your chosen solution integrates well with your CMS – whether it’s WordPress, Shopify, Wix, or HubSpot – and ensure it aligns with your analytics tools like Google Analytics.
Performance is another critical factor. A poorly implemented script can cause a flash of the original page before the variation loads. Opt for high-performance platforms to avoid this issue. Also, consider browser restrictions. For instance, Apple’s Intelligent Tracking Prevention (ITP) limits cookie storage to seven days, which can skew “unique visitor” data. Platforms using Local Storage (LS) for cookies can help maintain accurate data despite these restrictions.
Don’t forget to test your variations across different browsers and devices. A CTA that looks great on desktop Chrome might be misaligned on mobile Safari. Ensure buttons are large enough for easy tapping – at least 44×44 pixels – and leave enough whitespace to avoid accidental clicks on nearby elements. Try the “Squint Test”: step back and squint at your screen. If the CTA button isn’t the most noticeable element on the page, you may need to adjust its contrast or spacing. A thorough technical setup ensures your test runs smoothly and delivers reliable results, setting you up for success.
sbb-itb-6e49fcd
Running Your Test: Launch and Monitor
Once you’ve set up your test, the next step is launching it and keeping a close eye on its progress. Starting the test is just the beginning – monitoring it properly ensures you gather accurate and meaningful data.
Set a Specific Test Duration
Avoid the temptation to check results too early. Research shows that 70-80% of experiments produce misleading outcomes if stopped prematurely. From the start, decide on a test duration based on your calculated sample size and stick to it, no matter what early results suggest.
Plan to run your test for at least seven full days to account for fluctuations in user behavior throughout the week. Weekday visitors often behave differently than those browsing on weekends. This ensures your metrics reflect user behavior across the entire test period.
Track Performance Metrics
Once your test is running, focus on collecting the right data. While clicks are the primary metric for CTA placement tests, they’re just one piece of the puzzle. To get a clearer picture, calculate the View-to-Click Rate (CTR) by dividing CTA clicks by impressions – not total pageviews. This distinction matters because a CTA placed lower on the page might get fewer impressions, and using total pageviews could unfairly skew the results.
Measure your CTA Viewability Rate (impressions divided by pageviews) to pinpoint whether issues stem from poor placement or weak design. For example, if your CTA gets plenty of impressions but few clicks, the problem might be with the wording or visuals. Additionally, track secondary metrics like time on page, scroll depth, and form submissions to catch any unintended side effects. A 30% increase in clicks might not be a win if it’s paired with a 50% rise in bounce rate.
Use tools like session recordings to spot technical friction. Look for signs like “rage clicks”, where users repeatedly tap the same area, or situations where your CTA is cut off on mobile screens. For mobile users, monitor time to click – if clicks happen almost instantly (under one second), they might be accidental rather than intentional.
“In our experience, above-the-fold CTAs don’t always convert better. On informational pages, users often need context first, and mid-page CTAs consistently performed better.” Becky Halls, PageTest
To simplify monitoring, consider a no-code testing platform like PageTest.AI. These tools offer real-time dashboards that consolidate key metrics, helping you quickly identify trends and troubleshoot any issues.
Isolate the Variable Being Tested
Keep your test focused by changing only the CTA placement. Altering other elements during the test – like adding banners or updating product images – can muddy the results and make it impossible to draw clear conclusions.
Make a note of any external factors, such as holiday sales, breaking news, or technical problems, that might influence user behavior during the test. These details provide essential context when reviewing your data and help you decide whether to extend the test or restart it under more stable conditions. By controlling variables, you set the stage for accurate analysis and actionable insights.
After Your Test: Analyze and Apply Results
Once your testing phase wraps up, the next step is turning the data into actionable insights. This is where you dig into the results and make informed decisions to drive long-term improvements.
Check for Statistical Significance
Start by ensuring your results are statistically sound. A 95% confidence level is the gold standard, meaning there’s only a 5% chance the observed difference occurred by random chance. A p-value of 0.05 or less confirms this threshold.
Avoid relying on gut feelings – use tools like PageTest.AI to calculate statistical significance automatically. These tools also provide confidence intervals, such as “10% lift ± 3%”, to indicate where the actual result likely falls. If the intervals for your control and variant overlap significantly, you may not have a clear winner yet.
“Any experiment that involves later statistical inference requires a sample size calculation done BEFORE such an experiment starts. A/B testing is no exception.”
- Khalid Saleh, CEO and Co-founder, Invesp
For websites with lower traffic, aim for 200–300 conversions per variation before drawing conclusions. Keep in mind that smaller improvements, like a 5% lift, require larger sample sizes – around 40,000 users per version.
This careful approach ensures your results are reliable and sets the foundation for accurate documentation.
“CTA placement that worked well on desktop frequently failed on mobile. We’ve seen fixed or bottom-anchored CTAs outperform traditional placements once screen size and thumb reach were considered.” Ian Naylor, PageTest
Record Your Findings
Documenting your test results turns fleeting wins into lasting knowledge. Maintain a shared record – whether it’s a spreadsheet, database, or testing dashboard – that includes your hypothesis, test duration, traffic split, and the exact results achieved. For example, Invesp tested five price placements on a product detail page. Variation C, with the price above the “add to bag” button and reviews below, delivered a 5.07% conversion increase, while Variation B saw 3.39% and Variation E only 0.95%.
Break down the data by factors like device type, visitor category, and traffic source. This helps uncover trends, such as a CTA placement that performs well on mobile but poorly on desktop. Secondary metrics like scroll depth, bounce rate, and time on page add context – a 30% click increase isn’t as meaningful if half the users leave immediately.
Failures are just as important to document. They help you avoid repeating mistakes and refine future tests. As Bryan Clayton, CEO of GreenPal, explains:
“The value of testing is to get not just a lift but more of learning.”
With everything clearly recorded, you’re ready to implement the winning variation.
Roll Out the Winning Placement
Once you’ve confirmed statistical significance and analyzed the results, it’s time to update your site with the winning variation. Continue monitoring the same metrics for at least two weeks post-rollout to ensure the gains hold steady and to catch any technical issues.
Pay attention to how the winning variation performed across different segments. If it worked best for mobile users, consider implementing it selectively rather than across the entire site. Also, look beyond click-through rates to macro conversions like purchases or form submissions. This ensures the change doesn’t negatively impact lead quality.
Use these results to fuel your next test. For example, HubSpot’s marketing team ran a series of A/B tests on blog CTA anchor text. While individual tests showed small improvements, the cumulative effect of these tweaks led to a noticeable increase in annual leads. Testing is an ongoing process, not a one-and-done effort. As Carly Stec from HubSpot puts it:
“Just because something won once, doesn’t mean it can’t be beat. Keep going.”
Build on your findings for the next test. If moving the CTA higher on the page boosted clicks by 20%, try adding visual elements like arrows or more white space to amplify the effect. Roll out the validated changes and keep refining based on performance data. A/B testing is all about continuous improvement.
Conclusion
A/B testing your CTA placement is a process of constant learning and fine-tuning. By following this checklist, you’re replacing guesswork with data-driven decisions rooted in user behavior. When you focus on isolating variables, crafting clear hypotheses, and waiting for statistical significance, every adjustment you make is grounded in evidence – not opinion. This approach unlocks measurable improvements.
The rewards can be impressive. For example, optimizing CTA placement alone can increase user engagement by as much as 121%. In one case, a simple CTA adjustment tripled a company’s leads in just a month.
Each test deepens your understanding of your audience. As Carly Stec from HubSpot wisely points out:
“Don’t underestimate the importance of persistence in A/B testing”.
Even tests that don’t deliver the results you hoped for provide valuable insights. They help refine your hypotheses, avoid repeating mistakes, and guide future experiments.
Use these findings as a launchpad. For instance, if moving a CTA to the bottom-right corner increased conversions by 20%, consider testing whether adding urgency-focused language can amplify that success. Apply winning strategies across other pages to maximize their impact.
The best-performing companies treat conversion optimization as an ongoing effort, not a one-time project. Each test builds on the last, creating a cumulative effect that drives long-term growth. With this checklist in hand, you’re ready to make steady, systematic improvements that turn small wins into major competitive advantages.
FAQs
What’s the best way to find the ideal placement for my CTA?
To figure out the best spot for your CTA (Call to Action), think about how visitors naturally navigate your page. Studies suggest that people often scan a webpage in a “Z” or “F” pattern – starting from the top left, then either moving diagonally or scanning down. Placing your CTA in these high-visibility zones, such as above the fold, near the headline, or along these scanning paths, can grab attention and encourage action.
Since nearly 90% of visitors focus on the headline, placing your CTA nearby – whether it’s next to an image, key text, or the headline itself – can help boost click-through rates. Experimenting with different placements, like embedding it within the content or positioning it at the bottom of the page, and reviewing performance metrics can reveal the most effective layout for your audience.
What mistakes should I avoid when A/B testing CTA placement?
When you’re testing where to place your call-to-action (CTA), it’s easy to make missteps that can skew results or waste time. Here are some common pitfalls to watch out for:
- Overlooking user behavior: If you skip analyzing how users interact with your site, you might miss key insights about how placement impacts engagement. Pay attention to heatmaps, scroll depth, and click patterns.
- Testing too many changes at once: Stick to one variable at a time – like moving the button from the top of the page to the bottom. This makes it easier to pinpoint what’s actually driving any changes in performance.
- Ignoring audience segmentation: Different groups of users (like new visitors vs. returning ones) may react differently to your CTA placement. Breaking your audience into segments can give you more precise and actionable results.
- Starting without a clear hypothesis: If you don’t have a specific goal or question in mind, your test results might end up being confusing or irrelevant. Always define what you’re looking to learn before you start.
By steering clear of these mistakes and setting up your tests with a clear plan, you’ll be in a much better position to gather data that can genuinely boost your site’s conversion rates.
How can I make sure my A/B test results are reliable and accurate?
To make sure your A/B test delivers reliable results, focus on these essential steps:
- Ensure a sufficient sample size: Having enough participants is crucial to identify meaningful differences between variations.
- Randomize user assignment: Randomly assign users to each variation to eliminate bias and ensure fairness.
- Let the test run its course: Run the test long enough to capture variations in user behavior over time.
- Analyze results thoroughly: Check that the differences between variations are statistically significant and not just random noise.
Sticking to these steps and using a well-thought-out checklist will help you confidently assess your CTA placement and make smart, data-backed decisions for your website.
Related Blog Posts
say hello to easy Content Testing
try PageTest.AI tool for free
Start making the most of your websites traffic and optimize your content and CTAs.
Related Posts

![]() 30-03-2026
30-03-2026
 Ian Naylor
How Internal Links Boost Conversions
Strategic internal links guide users, improve SEO, and turn site navigation into measurable conversion growth.

![]() 28-03-2026
28-03-2026
Ian Naylor
Core Web Vitals Benchmarks by Industry
Industry Core Web Vitals benchmarks and practical fixes for LCP, INP, and CLS, plus mobile vs desktop gaps and optimization tips.

![]() 26-03-2026
26-03-2026
Ian Naylor
How to Benchmark Mobile Retention Rates
Benchmark Day 1/7/30 retention, run cohort analysis, and optimize onboarding, habit triggers, and personalization to improve app retention.