

A/B Testing FAQ: Common Questions Answered
A/B Testing FAQ: Common Questions Answered
![]() 25-06-2025 (Last modified: 25-06-2025)
25-06-2025 (Last modified: 25-06-2025)
A/B testing is a method to compare two versions of content (like a webpage or email) to see which performs better. It’s data-driven, helping you make decisions based on actual results instead of guesses. Here’s what you need to know:
- What it is: A way to test changes to websites, emails, ads, or apps by splitting traffic between a control (A) and a variation (B).
- Why it matters: It helps improve conversion rates, reduce bounce rates, and understand user behavior.
- Examples: Amazon increased profits by millions by moving credit card ads, and Bing boosted revenue by 12% with a headline tweak.
- How to start: Set clear goals, test one change at a time, and ensure you have enough traffic for reliable results.
- Key metrics: Track conversion rates, click-through rates, bounce rates, and revenue per user.
- Common mistakes: Avoid testing with too little traffic, stopping tests early, or misreading results.
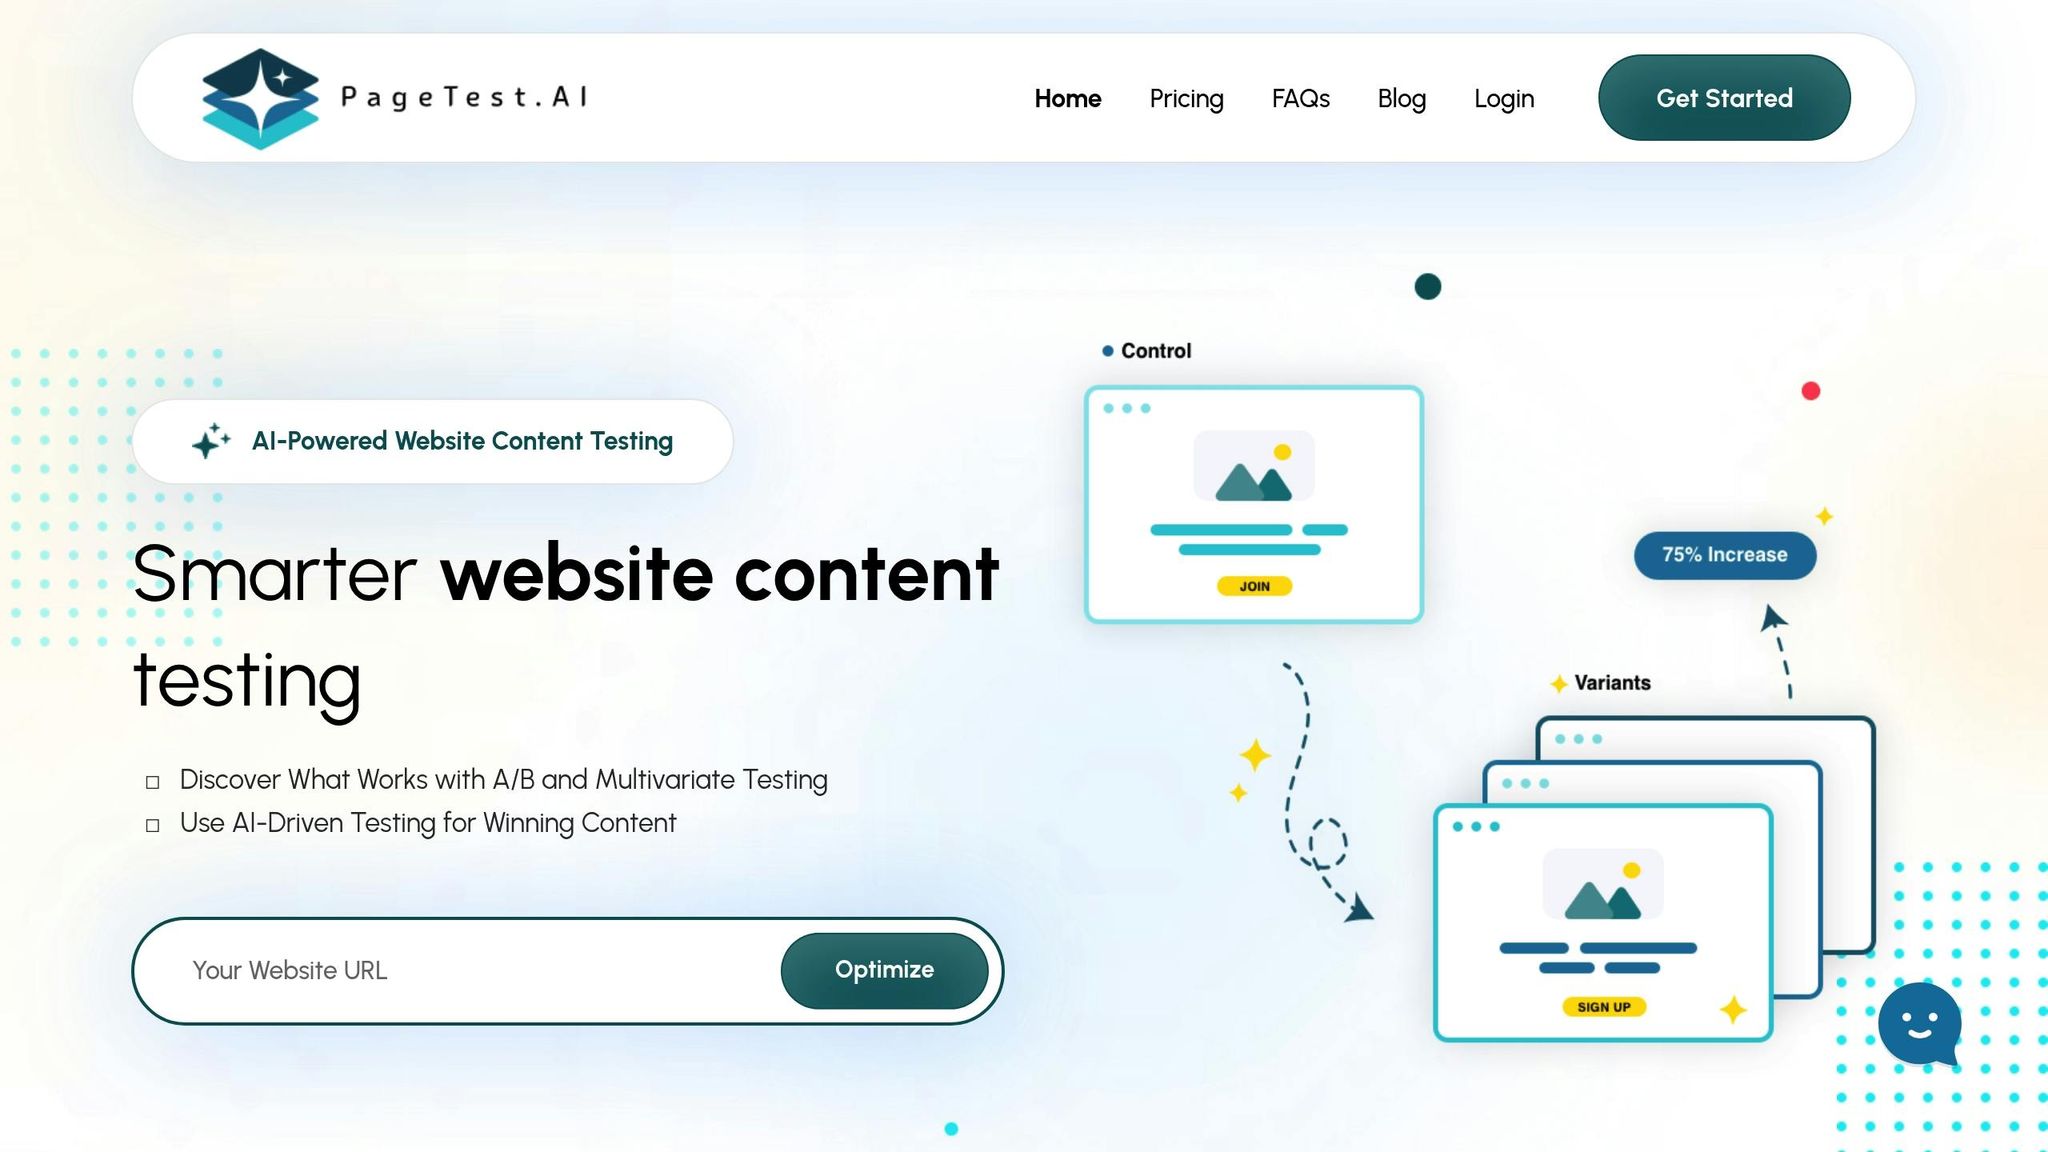
A/B testing isn’t just for big companies – anyone can use it to make smarter, data-backed decisions. Tools like PageTest.AI simplify the process with no-code setups and AI-generated test ideas.
The ultimate guide to A/B testing | Ronny Kohavi (Airbnb, Microsoft, Amazon)
How to Set Up A/B Tests
Getting reliable results from A/B testing starts with a solid setup. Once you’ve nailed down clear goals and identified the elements you want to test, it’s time to create distinct versions for comparison.
Set Goals and Pick Test Elements
Start with a hypothesis based on user research and business insights. The goal is to address specific user challenges through carefully designed tests.
Define what success looks like for your test. Whether you’re trying to boost email sign-ups, increase purchases, or cut down cart abandonment rates, your goals will determine the metrics you track and how you’ll measure success.
Focus on elements that influence first impressions and drive conversions. For instance, headlines are crucial since users form opinions in as little as 50 milliseconds. You could test product-focused versus outcome-focused messaging or compare short headlines to more detailed ones.
Here’s an example: During the Obama campaign, simply changing the call-to-action (CTA) from "Sign Up" to "Learn More" led to a 40.6% increase in sign-ups, which translated to an additional $60 million in donations.
Stick to testing one element at a time to ensure your results are accurate and actionable.
Once your goals are set and elements identified, it’s time to create your control and test versions.
Create Control and Test Versions
Your control version (A) is the existing page or element, unchanged, to serve as your baseline. The test version (B) introduces the single change you want to evaluate.
Make sure the change you’re testing is significant enough to potentially influence user behavior. Small tweaks, like changing "Buy Now" to "Purchase Now", may not yield noticeable results. Instead, try more impactful adjustments.
For example, Swiss Gear found their product pages were cluttered and lacked a clear hierarchy. By reducing clutter, improving visual order, and enlarging CTA buttons, they achieved a 52% increase in conversions, with seasonal peaks reaching 137% during high-traffic periods.
If your test involves redirecting users to a variation URL, use a 302 redirect instead of a 301. A 302 redirect signals that the change is temporary, avoiding any negative impact on SEO.
Once your versions are ready, it’s time to split your traffic and calculate the sample size needed for valid results.
Split Traffic and Calculate Sample Size
Before launching your test, calculate the sample size required to ensure accurate results. This step helps avoid ending tests too soon or letting them run longer than necessary.
"In A/B testing, sample size describes the number of visitors you need to accurately run a valid test." – Deborah O’Malley, M.Sc
As a general guideline, aim for at least 30,000 visitors and 3,000 conversions per variant for dependable results. However, your exact requirements will depend on factors like your baseline conversion rate, the smallest improvement you want to detect, and your desired confidence level.
To get precise numbers, use a sample size calculator. Input your current conversion rate, the smallest improvement worth measuring (usually 10–20%), and a significance level, typically set at 5%.
Don’t forget to consider external factors that could skew your results. With over 63.38% of global web traffic now coming from mobile devices, make sure your test accounts for mobile behavior. Seasonal trends and marketing campaigns can also influence user behavior, so plan your testing timeline accordingly.
Run your test for at least 1–2 weeks to capture variations in user behavior. Many tests run between 2 to 6 weeks, depending on your traffic and the size of the effect you’re measuring. This timeframe helps ensure you’re capturing a diverse range of user interactions across different days of the week.
Proper sample sizes help you avoid false positives or negatives. And remember, only about one in seven A/B tests delivers a winning result, so persistence and patience are key to building a successful testing strategy.
How to Read A/B Test Results
Once your A/B test is up and running, the next step is to dive into the results. This is where you fine-tune your strategies by interpreting the data you’ve gathered. Understanding the outcomes and knowing how to act on them is what sets efficient testing apart from wasted effort.
Key Metrics to Track
After launching your test, focus on metrics that directly align with your goals. These should validate your hypothesis and tie into your broader business objectives.
Start with your primary conversion metric, the one that directly measures the success of your test. For example, if you’re testing a checkout page, this might be completed purchases. On a landing page, it could be email sign-ups or demo requests.
In addition to your primary metric, keep an eye on these critical indicators:
- Click-through rate (CTR): Tracks user interactions with buttons and links.
- Conversion rate: Measures the percentage of visitors completing your desired action. The median across industries is 4.3%.
- Bounce rate: Shows how many visitors leave without further engagement.
- Scroll depth: Reveals content engagement, with good rates typically between 60% and 80% of a page.
- Average order value (AOV): Essential for e-commerce, this helps compare profit margins between page variations.
- Revenue per user: Useful for evaluating pricing strategies or upsell offers.
- Session duration and retention rate: Indicate long-term engagement and help identify which test variation encourages repeat visits.
"Connecting your goals and project guarantees you consistently choose KPIs that make a real difference. It’s important to consider the availability and reliability of data. Some metrics may be easier to track and measure than others or may be more prone to fluctuations or inaccuracies. It’s important to choose metrics that can be consistently tracked and measured over time to ensure the validity of the KPIs." – Chinmay Daflapurkar, Digital Marketing Associate, Arista Systems
Segmenting your results is equally important. Break down data by user behavior or demographics to avoid misleading conclusions. For instance, mobile users often behave differently than desktop users, and new visitors may act differently than returning ones.
Statistical Significance Explained
Statistical significance helps determine whether your test results are meaningful or just random noise. It ensures that the findings are real and not due to chance.
The p-value is the key metric here. A p-value below 0.05 is generally considered statistically significant, meaning there’s less than a 5% chance the observed difference is random. The smaller the p-value, the more confident you can be in your results.
For example, SurveyMonkey conducted an A/B test with 50,000 visitors for each variant. Variant A had 500 conversions (1.00% conversion rate), while Variant B had 570 conversions (1.14% conversion rate). The p-value was 0.0157, making the 14% difference statistically significant.
That said, statistical significance doesn’t always mean the result is worth acting on. Even if a result is statistically significant, the effect size might be too small to justify the cost or effort of implementation. This is where confidence intervals come in handy, as they provide a range indicating where the true effect likely falls, helping you assess the real-world impact of your changes.
"Typically, you need to get to statistical significance, so a particular threshold you set for the test parameters indicates there’s been enough traffic over a given amount of time to start assessing the data. I typically start reporting after two weeks, but it depends on the brand and the site traffic. Then weekly reports are generated and presented to the client or team." – Meghan Carreau, Co-Founder & Executive UX Design Officer, Aztech
Using Dashboards to Analyze Data
Once you’ve established statistical confidence, dashboards can make your findings easier to interpret. A well-structured dashboard transforms raw data into actionable insights.
A/B test dashboards are particularly useful for comparing variants to see which performs better or worse. They visually display your metrics, helping you identify trends and patterns.
To set up an effective dashboard, organize your data logically:
- Start with your primary conversion metric at the top.
- Follow with supporting metrics that explain the "why" behind your results.
- Use bar charts to compare conversion rates and line charts to track trends over time.
Keep your dashboard clean and focused. Stick to a consistent color palette, using colors to highlight key data points without overwhelming the viewer. Avoid cluttering charts with too many categories; prioritize the top 5-7 metrics and group the rest.
"It’s important for us to see how we’re doing in real time, and we found the best way to do this is with Geckoboard." – Mike Miner, Head of Customer Support, JustPark
Your dashboard should tell a clear story. Add titles, axis labels, and chart legends for clarity, and avoid unnecessary 3D effects or embellishments that distract from the data. Tailor your visualizations to your audience’s familiarity with data. Use simple charts for less technical viewers and more detailed graphs for analytical teams.
The goal? Make your results easy for everyone to understand and act on. Platforms like PageTest.AI simplify this process by calculating statistical significance automatically and presenting key metrics in a user-friendly format, saving you time and effort.
sbb-itb-6e49fcd
Common A/B Testing Mistakes to Avoid
Even seasoned marketers can make missteps when running A/B tests. These errors can waste time, distort results, and lead to misguided decisions. Being aware of the most common pitfalls can help ensure your tests produce actionable and reliable insights.
Testing With Too Little Traffic
One of the biggest mistakes is running tests without enough visitors. A small sample size can lead to misleading results, making it hard to identify real differences between variations.
Your sample size depends on factors like your baseline conversion rate, the improvement you’re hoping to detect, and the number of variations being tested. The more variations you have, the more traffic you’ll need to achieve statistical significance. For example, many startups and small businesses with fewer than 100,000 visitors and 500 conversions a month fall into the low-traffic category. If this sounds like your situation, focus on high-traffic pages or track micro-conversions – actions that occur more frequently than your primary goal.
Testing minor changes with low traffic is especially risky. Small improvements, like a 0.5% or 1% increase, require a large sample size to detect. For low-traffic websites, these kinds of tests are unlikely to yield meaningful insights.
To avoid wasting time, use a test duration calculator before launching. This tool can estimate whether your test will generate statistically significant results in a reasonable timeframe. If the calculator suggests you’ll need six months to gather enough data, it may be better to focus on pages with higher traffic or rethink your approach.
Changing Tests While Running
Altering a test mid-run is a common way to invalidate your results. Making changes – such as adjusting traffic allocation, modifying test elements, or adding variations – disrupts the conditions under which the test started, leading to unreliable outcomes.
Another frequent mistake is stopping a test as soon as it hits statistical significance. While tempting, this practice significantly increases the risk of false positives. For instance, a simulation found that checking for significance every 100 visitors resulted in a 19.5% false positive rate, while checking after every visitor pushed the rate above 60%.
Heap, a data analytics company, learned this the hard way. They ran a headline test comparing "No code required" and "Capture everything." Early on, "No code required" appeared to be the winner, but when the test ran longer with a larger sample size, the difference disappeared. This early stopping created a false positive.
Heap explained, "By checking in on the experiment before it finished, we had a false positive result."
To maintain test integrity:
- Avoid adjusting traffic distribution between variations.
- Don’t add or remove variations mid-test.
- Resist the urge to modify test elements or audience targeting once the test has started.
If you need to monitor progress, set predetermined checkpoints and stick to them. Ideally, let the test run its full course before drawing conclusions.
Reading Results Wrong
Even with a well-executed test, misinterpreting results can lead to poor decisions. One common error is focusing solely on short-term trends without considering the broader context.
For example, Yatter, a lead generation agency, noticed high drop-off rates on the checkout page of a stem cell therapy website. Initially, they assumed the checkout page itself was the problem. But after reviewing session replays, they discovered the real issue: a lack of compelling product information earlier in the funnel. By adding case studies and an explanatory video, they boosted conversions by 10%.
Similarly, Bannersnack improved feature adoption by 12% after session replays revealed users were overlooking a smaller "show timeline" button. Simply making the button larger solved the issue. These examples highlight the importance of understanding user behavior rather than just chasing numbers.
Common interpretation mistakes include:
- Ignoring secondary metrics or downstream effects.
- Failing to segment results by device, traffic source, or user type.
- Mistaking correlation for causation.
- Overemphasizing statistical significance without considering practical impact.
- Overlooking external factors that might influence results.
Documentation is key to avoiding these errors. Without clear records of your hypothesis, setup, and any external influences, it’s hard to make sense of results later. Always document your tests thoroughly.
Another trap is falling for novelty effects. Sometimes, users respond positively to a change simply because it’s new, not because it’s better. This initial excitement often fades after a few weeks, so avoid making permanent changes based on short-term gains.
Lastly, always validate your findings. If a test shows a 20% improvement that seems too good to be true, it probably is. Running follow-up tests can confirm whether the results are reliable.
PageTest.AI A/B Testing Features
PageTest.AI takes the guesswork out of A/B testing by blending AI technology with an intuitive design. Its features are designed to make the process smoother and more effective, addressing common challenges faced by marketers.
AI-Generated Test Variations
Coming up with multiple test variations can be a time-consuming and creative drain. PageTest.AI simplifies this by using AI to generate up to 10 optimized alternatives for elements like headlines, call-to-action buttons, or product descriptions. These suggestions are based on conversion data, analyzing what has worked well in the past to predict what might perform better. For example, one AI-generated variation increased performance by 297%, while another saw a 220% boost. You can either use these AI suggestions as they are or tweak them to better align with your brand.
No-Code Test Setup
Technical hurdles often discourage marketers – especially those without dedicated developers – from running A/B tests. PageTest.AI eliminates this issue with its no-code approach. Using a Chrome extension, you can select any element on your webpage for testing with just a few clicks. The platform guides you step-by-step, from choosing elements to test to defining success metrics like clicks, scroll depth, time on page, or visits to a specific URL. This makes it easy for anyone to set up and manage sophisticated tests without writing a single line of code.
Advanced Performance Tracking
Tracking results is just as important as setting up the test. PageTest.AI doesn’t stop at basic click tracking – it provides detailed insights into user behavior, including metrics like time spent on the page, scroll depth, and interaction patterns. The platform’s AI also analyzes these behaviors to predict which visitors are most likely to convert. With real-time analytics, you can monitor test performance as it happens, ensuring that the winning variation reflects real improvements rather than random fluctuations.
Marketers have praised the platform for helping them maximize website traffic while keeping costs low. It’s also been noted for its ability to optimize web content effectively, enhancing SEO efforts in the process.
Key Takeaways
Why Your Website Needs A/B Testing
A/B testing takes the guesswork out of improving your website by relying on data to guide decisions. Companies using conversion rate optimization (CRO) tools report an average ROI of 223%, with 5% of businesses seeing returns above 1,000%. That’s a big deal.
By pinpointing what resonates with users and what doesn’t, A/B testing allows for ongoing improvements that can give you a competitive edge. In fact, over 70% of marketers now use insights from CRO campaigns to shape their strategies. However, it’s worth noting that only 25% of A/B tests succeed. Even so, every test – whether it “wins” or not – provides valuable insights to refine your approach.
How PageTest.AI Makes A/B Testing Simple
PageTest.AI makes the process of A/B testing easier than ever. Traditional testing often requires coding skills and technical know-how, which can be a hurdle for many marketers. PageTest.AI eliminates this challenge with its no-code functionality. Using a Chrome extension, you can test any website element with just a few clicks – no coding required.
One standout feature is the platform’s AI-powered content generation, which simplifies the creation of test variations. Whether you’re tweaking headlines, call-to-action buttons, or other key elements, the tool generates optimized alternatives based on conversion data. Plus, it tracks detailed metrics like clicks, engagement, time spent on a page, and scroll depth, giving you a clear picture of user behavior.
Your Next Steps for Better A/B Testing
With the right tools and data in hand, it’s time to take action. A/B testing isn’t a one-and-done task – it’s an ongoing process that drives long-term growth. Start by defining your goals and forming clear hypotheses for your tests. Focus on experimenting with key elements such as headlines, images, CTA buttons, and copy.
One test might succeed, but the real magic happens when you consistently analyze and refine your results. Brands that embrace this mindset often see lasting gains in conversion rates, engagement, and revenue. For example, Nextbase achieved a 122% increase in conversion rates through personalization.
Don’t forget to gather customer feedback and keep an eye on conversion trends for continuous improvement. Share your findings with your team to foster a culture of experimentation. And with PageTest.AI offering a free Trial plan that includes 10,000 test impressions, there’s nothing stopping you from diving into professional A/B testing today.
FAQs
How can small businesses run effective A/B tests with low website traffic?
Small businesses with limited website traffic can still make A/B testing work by zeroing in on key areas and keeping things straightforward. A good place to start? Focus on high-traffic pages like your homepage or main landing pages – these spots give you the best chance to gather enough data. Keep it simple by testing just a few variations to ensure your results are meaningful, even with less traffic.
Rather than aiming for long-term metrics like revenue, shift your attention to micro-conversions. Think clicks, form submissions, or sign-ups – these smaller actions are quicker to measure and easier to track with fewer visitors. Another tip? Use session-based data instead of user-based data. This approach lets you capture more interactions, boosting the reliability of your results.
By staying focused and keeping your tests manageable, you can uncover practical insights to enhance your website’s performance, even with a smaller audience.
What are the best practices for accurately interpreting A/B test results?
To make sense of A/B test results, the first step is to ensure statistical significance. This is crucial to avoid jumping to conclusions based on false positives, which can mislead you into thinking one variation outperforms the other when it doesn’t.
Next, let your test run long enough to gather a large enough sample size. This helps account for natural variations in user behavior. Cutting a test short might leave you with unreliable data that doesn’t paint the full picture. Also, be mindful of external influences like seasonal trends or marketing campaigns, as these can skew your results.
Lastly, always evaluate your findings with your specific goals in mind. Whether you’re aiming to boost conversion rates or enhance user engagement, aligning your analysis with these objectives ensures your decisions are grounded in meaningful data.
How does PageTest.AI make A/B testing easy for users without technical expertise?
PageTest.AI takes the complexity out of A/B testing with its user-friendly, no-code platform. Thanks to its point-and-click interface, marketing and product teams can design, execute, and oversee tests without writing a single line of code.
From creating variations to diving into the results, the platform simplifies every step. It’s an ideal solution for non-technical users looking to enhance their website’s performance and boost conversion rates with minimal effort.
Related posts
say hello to easy Content Testing
try PageTest.AI tool for free
Start making the most of your websites traffic and optimize your content and CTAs.
Related Posts

![]() 30-03-2026
30-03-2026
 Ian Naylor
How Internal Links Boost Conversions
Strategic internal links guide users, improve SEO, and turn site navigation into measurable conversion growth.

![]() 28-03-2026
28-03-2026
Ian Naylor
Core Web Vitals Benchmarks by Industry
Industry Core Web Vitals benchmarks and practical fixes for LCP, INP, and CLS, plus mobile vs desktop gaps and optimization tips.

![]() 26-03-2026
26-03-2026
Ian Naylor
How to Benchmark Mobile Retention Rates
Benchmark Day 1/7/30 retention, run cohort analysis, and optimize onboarding, habit triggers, and personalization to improve app retention.